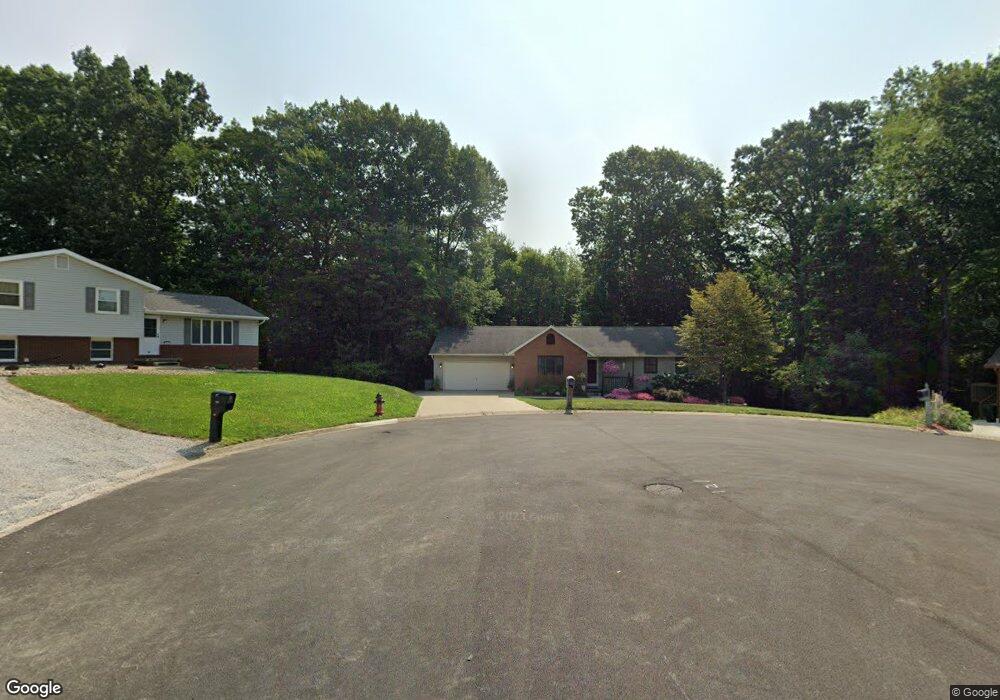
1212 George St SW Canton, OH 44706
Estimated Value: $258,645 - $308,000
3
Beds
2
Baths
1,616
Sq Ft
$172/Sq Ft
Est. Value
About This Home
This home is located at 1212 George St SW, Canton, OH 44706 and is currently estimated at $277,911, approximately $171 per square foot. 1212 George St SW is a home located in Stark County with nearby schools including Faircrest Memorial Elementary School, Canton South High School, and Beacon Academy.
Ownership History
Date
Name
Owned For
Owner Type
Purchase Details
Closed on
Feb 23, 2022
Sold by
Phillips Kristy N and Phillips Jason A
Bought by
Phillips Jason A and Phillips Kristy N
Current Estimated Value
Purchase Details
Closed on
Jun 24, 2016
Sold by
Phillips Kristy N and Phillips Jason Allen
Bought by
Phillips Kristy N and Phillips Jason Allen
Home Financials for this Owner
Home Financials are based on the most recent Mortgage that was taken out on this home.
Original Mortgage
$127,222
Interest Rate
4.19%
Mortgage Type
FHA
Purchase Details
Closed on
Apr 29, 2009
Sold by
Mcatee Gregory L and Mcatee Cynthia J
Bought by
Tallman Kristy N
Home Financials for this Owner
Home Financials are based on the most recent Mortgage that was taken out on this home.
Original Mortgage
$147,130
Interest Rate
5.05%
Mortgage Type
FHA
Purchase Details
Closed on
Aug 31, 1992
Create a Home Valuation Report for This Property
The Home Valuation Report is an in-depth analysis detailing your home's value as well as a comparison with similar homes in the area
Home Values in the Area
Average Home Value in this Area
Purchase History
| Date | Buyer | Sale Price | Title Company |
|---|---|---|---|
| Phillips Jason A | -- | Brown & Percival Co Lpa | |
| Phillips Kristy N | -- | None Available | |
| Tallman Kristy N | $149,900 | Attorney | |
| -- | $108,000 | -- |
Source: Public Records
Mortgage History
| Date | Status | Borrower | Loan Amount |
|---|---|---|---|
| Previous Owner | Phillips Kristy N | $127,222 | |
| Previous Owner | Tallman Kristy N | $147,130 |
Source: Public Records
Tax History Compared to Growth
Tax History
| Year | Tax Paid | Tax Assessment Tax Assessment Total Assessment is a certain percentage of the fair market value that is determined by local assessors to be the total taxable value of land and additions on the property. | Land | Improvement |
|---|---|---|---|---|
| 2025 | -- | $82,820 | $14,320 | $68,500 |
| 2024 | -- | $82,820 | $14,320 | $68,500 |
| 2023 | $2,858 | $63,390 | $10,680 | $52,710 |
| 2022 | $2,648 | $63,390 | $10,680 | $52,710 |
| 2021 | $2,659 | $63,390 | $10,680 | $52,710 |
| 2020 | $2,602 | $54,430 | $9,240 | $45,190 |
| 2019 | $2,640 | $54,430 | $9,240 | $45,190 |
| 2018 | $2,619 | $54,430 | $9,240 | $45,190 |
| 2017 | $2,698 | $52,930 | $9,350 | $43,580 |
| 2016 | $2,584 | $50,620 | $9,350 | $41,270 |
| 2015 | $2,587 | $50,620 | $9,350 | $41,270 |
| 2014 | $445 | $44,950 | $8,300 | $36,650 |
| 2013 | $1,230 | $44,950 | $8,300 | $36,650 |
Source: Public Records
Map
Nearby Homes
- 1521 Bravado Rd SW
- 3245 Sierra Ave SW
- 1550 Rebel St SW
- 3641 Diane Ave SW
- 3673 Highview Ave SW
- 236 32nd St SW
- 3223 Dueber Ave SW
- 3415 Cleveland Ave SW
- 4314 Millport Ave SW
- 223 Faircrest St SW
- 3939 Cleveland Ave SW
- 4624 Ridge Ave SE
- 900 53rd St SW
- 0 20th St SW
- 5226 Ashmont Ave SW
- 1700 Clark Ave SW
- 1815 Vine Ave SW
- 1628 Clark Ave SW
- 340 53rd St SW
- 3463 Shepler Church Ave SW
- 1216 George St SW
- 1213 George St SW
- 3648 Dave Ave SW
- 1223 George St SW
- 3660 Dave Ave SW
- 1303 George St SW
- 1134 Carnwise St SW
- 1208 Carnwise St SW
- 1216 Carnwise St SW
- 1124 Carnwise St SW
- 3674 Dave Ave SW
- 1300 Carnwise St SW
- 1315 George St SW
- 3655 Dave Ave SW
- 1114 Carnwise St SW
- 1104 Carnwise St SW
- 1330 George St SW
- 1327 George St SW
- 1014 Carnwise St SW
- 1320 Carnwise St SW