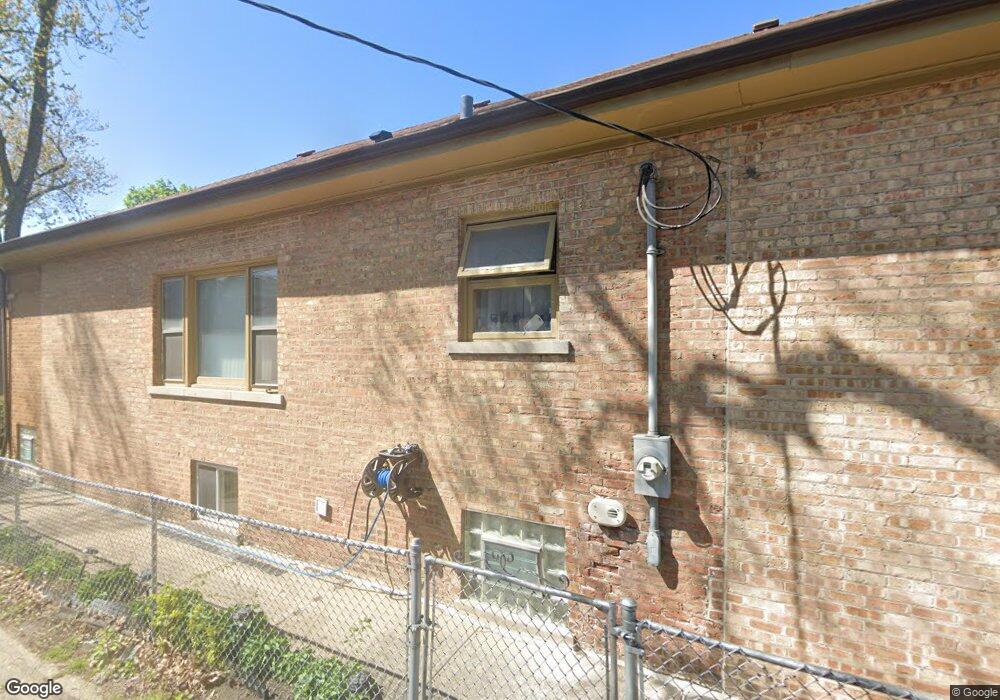
1212 Hayes Ave Oak Park, IL 60302
Estimated Value: $347,000 - $478,000
3
Beds
1
Bath
1,227
Sq Ft
$328/Sq Ft
Est. Value
About This Home
This home is located at 1212 Hayes Ave, Oak Park, IL 60302 and is currently estimated at $402,912, approximately $328 per square foot. 1212 Hayes Ave is a home located in Cook County with nearby schools including William Hatch Elementary School, Gwendolyn Brooks Middle School, and Oak Park and River Forest High School.
Ownership History
Date
Name
Owned For
Owner Type
Purchase Details
Closed on
Mar 23, 2015
Sold by
Floyd Muriel and Floyd Steven
Bought by
Floyd Muriel and Sanders Melissa
Current Estimated Value
Purchase Details
Closed on
Oct 20, 2005
Sold by
Floyd Steven
Bought by
Floyd Steven and Floyd Muriel
Purchase Details
Closed on
Oct 24, 2000
Sold by
Sanders Sharon
Bought by
Floyd Steven D
Home Financials for this Owner
Home Financials are based on the most recent Mortgage that was taken out on this home.
Original Mortgage
$168,000
Interest Rate
9.87%
Purchase Details
Closed on
Aug 20, 1998
Sold by
Banks Johnnie and Wilson Allen J
Bought by
Floyd Steven D and Sanders Sharon
Home Financials for this Owner
Home Financials are based on the most recent Mortgage that was taken out on this home.
Original Mortgage
$136,452
Interest Rate
6.99%
Mortgage Type
FHA
Create a Home Valuation Report for This Property
The Home Valuation Report is an in-depth analysis detailing your home's value as well as a comparison with similar homes in the area
Home Values in the Area
Average Home Value in this Area
Purchase History
| Date | Buyer | Sale Price | Title Company |
|---|---|---|---|
| Floyd Muriel | -- | None Listed On Document | |
| Floyd Steven | -- | -- | |
| Floyd Steven D | -- | -- | |
| Floyd Steven D | $140,000 | -- |
Source: Public Records
Mortgage History
| Date | Status | Borrower | Loan Amount |
|---|---|---|---|
| Previous Owner | Floyd Steven D | $168,000 | |
| Previous Owner | Floyd Steven D | $136,452 |
Source: Public Records
Tax History Compared to Growth
Tax History
| Year | Tax Paid | Tax Assessment Tax Assessment Total Assessment is a certain percentage of the fair market value that is determined by local assessors to be the total taxable value of land and additions on the property. | Land | Improvement |
|---|---|---|---|---|
| 2024 | $9,351 | $32,000 | $5,997 | $26,003 |
| 2023 | $10,455 | $32,000 | $5,997 | $26,003 |
| 2022 | $10,455 | $30,649 | $5,190 | $25,459 |
| 2021 | $10,222 | $30,647 | $5,189 | $25,458 |
| 2020 | $10,055 | $30,647 | $5,189 | $25,458 |
| 2019 | $10,346 | $30,396 | $4,728 | $25,668 |
| 2018 | $9,956 | $30,396 | $4,728 | $25,668 |
| 2017 | $9,759 | $30,396 | $4,728 | $25,668 |
| 2016 | $9,130 | $25,180 | $3,921 | $21,259 |
| 2015 | $8,134 | $25,180 | $3,921 | $21,259 |
| 2014 | $7,577 | $25,180 | $3,921 | $21,259 |
| 2013 | $7,627 | $26,066 | $3,921 | $22,145 |
Source: Public Records
Map
Nearby Homes
- 102 Le Moyne Pkwy
- 1221 Hayes Ave
- 34 Le Moyne Pkwy
- 1115 N Taylor Ave
- 1618 N Mcvicker Ave
- 1212 N Harvey Ave
- 222 Le Moyne Pkwy
- 1625 N Mcvicker Ave
- 1122 N Ridgeland Ave
- 1715 N Meade Ave
- 1622 N Mason Ave
- 1657 N Austin Ave
- 1322 N Austin Blvd
- 1001 N Taylor Ave
- 1418 N Mayfield Ave
- 1003 Mapleton Ave
- 1221 Edmer Ave
- 1627 N Narragansett Ave
- 1511 N Monitor Ave
- 921 N Humphrey Ave
- 1218 Hayes Ave
- 1220 Hayes Ave
- 118 Le Moyne Pkwy
- 122 Le Moyne Pkwy
- 114 Le Moyne Pkwy
- 1222 Hayes Ave
- 110 Le Moyne Pkwy
- 1213 N Taylor Ave
- 1215 N Taylor Ave
- 108 Le Moyne Pkwy
- 1219 N Taylor Ave
- 1226 Hayes Ave
- 1221 N Taylor Ave
- 104 Le Moyne Pkwy
- 1213 Hayes Ave
- 1228 Hayes Ave
- 1215 Hayes Ave
- 1225 N Taylor Ave
- 1219 Hayes Ave
- 134 Le Moyne Pkwy