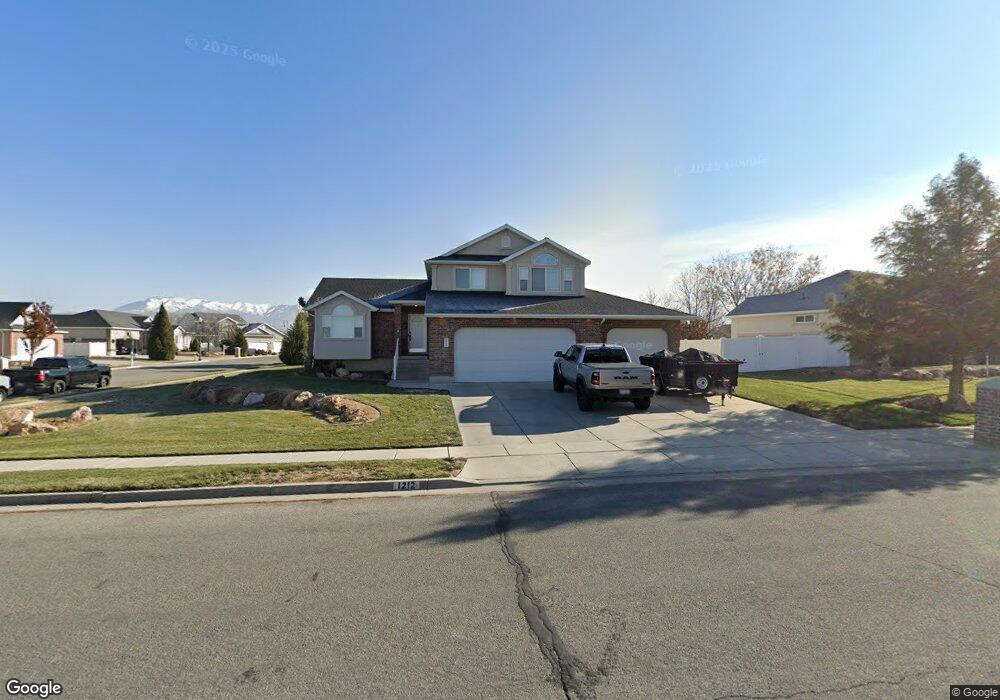
1212 N 2220 W Clearfield, UT 84015
Estimated Value: $583,000 - $720,000
4
Beds
4
Baths
2,894
Sq Ft
$217/Sq Ft
Est. Value
About This Home
This home is located at 1212 N 2220 W, Clearfield, UT 84015 and is currently estimated at $628,577, approximately $217 per square foot. 1212 N 2220 W is a home located in Davis County with nearby schools including Lakeside School, West Point Junior High School, and Syracuse High School.
Ownership History
Date
Name
Owned For
Owner Type
Purchase Details
Closed on
Jun 12, 2017
Sold by
Linscott Christi A and Linscott Roger E
Bought by
Farr Chandler and Farr Shy
Current Estimated Value
Purchase Details
Closed on
Nov 2, 2001
Sold by
Ron Nelson & Sons Construction Inc
Bought by
Linscott Roger E and Linscott Christi A
Home Financials for this Owner
Home Financials are based on the most recent Mortgage that was taken out on this home.
Original Mortgage
$119,000
Interest Rate
6.84%
Purchase Details
Closed on
May 7, 2001
Sold by
Clinton Fields Lc
Bought by
Ron Nelson & Sons Construction Inc
Home Financials for this Owner
Home Financials are based on the most recent Mortgage that was taken out on this home.
Original Mortgage
$146,200
Interest Rate
6.92%
Mortgage Type
Construction
Create a Home Valuation Report for This Property
The Home Valuation Report is an in-depth analysis detailing your home's value as well as a comparison with similar homes in the area
Home Values in the Area
Average Home Value in this Area
Purchase History
| Date | Buyer | Sale Price | Title Company |
|---|---|---|---|
| Farr Chandler | -- | -- | |
| Linscott Roger E | -- | Heritage West Title Insuranc | |
| Ron Nelson & Sons Construction Inc | -- | Heritage West Title Insuranc |
Source: Public Records
Mortgage History
| Date | Status | Borrower | Loan Amount |
|---|---|---|---|
| Previous Owner | Linscott Roger E | $119,000 | |
| Previous Owner | Ron Nelson & Sons Construction Inc | $146,200 |
Source: Public Records
Tax History Compared to Growth
Tax History
| Year | Tax Paid | Tax Assessment Tax Assessment Total Assessment is a certain percentage of the fair market value that is determined by local assessors to be the total taxable value of land and additions on the property. | Land | Improvement |
|---|---|---|---|---|
| 2025 | $3,083 | $296,450 | $104,000 | $192,450 |
| 2024 | $2,970 | $287,100 | $112,281 | $174,819 |
| 2023 | $2,801 | $501,000 | $131,335 | $369,665 |
| 2022 | $2,974 | $294,250 | $76,011 | $218,239 |
| 2021 | $2,719 | $399,000 | $102,546 | $296,454 |
| 2020 | $2,485 | $361,000 | $91,292 | $269,708 |
| 2019 | $2,474 | $351,000 | $99,078 | $251,922 |
| 2018 | $2,410 | $336,000 | $82,735 | $253,265 |
| 2016 | $1,118 | $156,475 | $31,412 | $125,063 |
| 2015 | $2,171 | $148,620 | $31,412 | $117,208 |
| 2014 | $795 | $129,713 | $31,412 | $98,301 |
| 2013 | -- | $137,813 | $32,372 | $105,441 |
Source: Public Records
Map
Nearby Homes
- 1186 N 2220 W
- 1186 N 2220 W Unit 14
- 2177 W 1230 N
- 2177 W 1230 N Unit 12
- 1174 N 2220 W
- 2206 W 1230 N
- 2206 W 1230 N Unit 5
- 1219 N 2220 W
- 1219 N 2220 W Unit 18
- 2188 W 1230 N
- 2188 W 1230 N Unit 6
- 1231 N 2220 W
- 1231 N 2220 W Unit 19
- 1193 N 2220 W
- 1193 N 2220 W Unit 17
- 1197 N 2155 W
- 1197 N 2155 W Unit 11
- 2166 W 1230 N Unit 7
- 1247 N 2220 W
- 1247 N 2220 W Unit 20