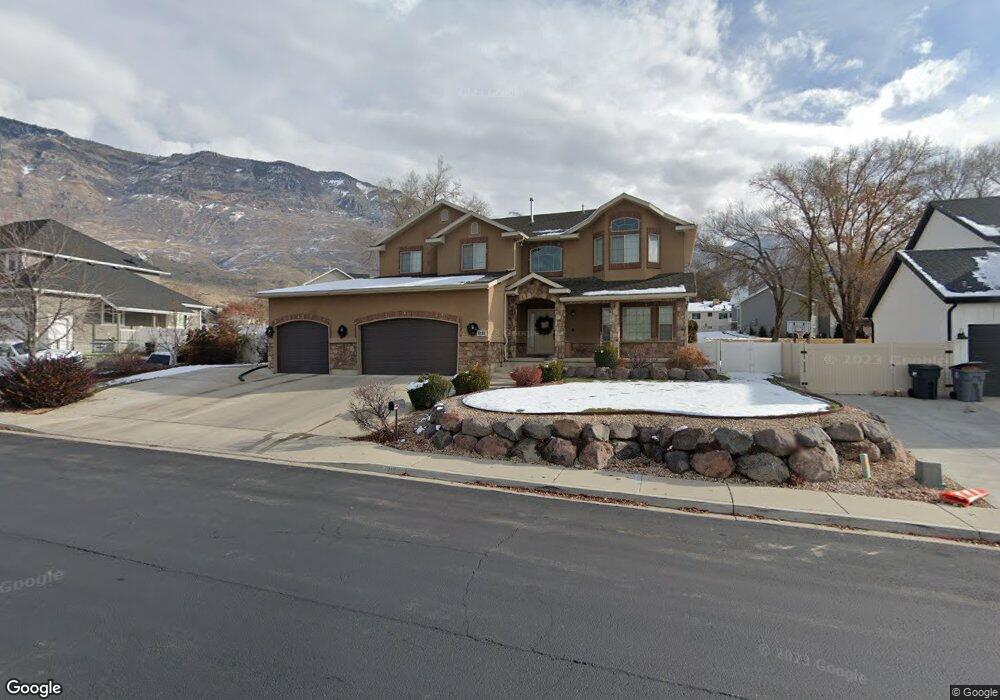
1212 N 300 E Pleasant Grove, UT 84062
Estimated Value: $755,910 - $905,000
5
Beds
3
Baths
2,708
Sq Ft
$299/Sq Ft
Est. Value
About This Home
This home is located at 1212 N 300 E, Pleasant Grove, UT 84062 and is currently estimated at $809,970, approximately $299 per square foot. 1212 N 300 E is a home with nearby schools including Grovecrest Elementary School, Pleasant Grove Junior High School, and Pleasant Grove High School.
Ownership History
Date
Name
Owned For
Owner Type
Purchase Details
Closed on
Aug 12, 2021
Sold by
Smith Jacob H
Bought by
Smith Jacob H and Smith Andrea
Current Estimated Value
Home Financials for this Owner
Home Financials are based on the most recent Mortgage that was taken out on this home.
Original Mortgage
$335,000
Outstanding Balance
$301,976
Interest Rate
2.9%
Mortgage Type
New Conventional
Estimated Equity
$507,994
Purchase Details
Closed on
Jun 10, 2010
Sold by
Central Bank
Bought by
Smith Jacob H and Smith Andrea
Home Financials for this Owner
Home Financials are based on the most recent Mortgage that was taken out on this home.
Original Mortgage
$241,870
Interest Rate
4.99%
Mortgage Type
Seller Take Back
Create a Home Valuation Report for This Property
The Home Valuation Report is an in-depth analysis detailing your home's value as well as a comparison with similar homes in the area
Home Values in the Area
Average Home Value in this Area
Purchase History
| Date | Buyer | Sale Price | Title Company |
|---|---|---|---|
| Smith Jacob H | -- | Accommodation/Courtesy Recordi | |
| Smith Jacob H | -- | Inwest Title | |
| Smith Jacob H | -- | Pro Title & Escrow Inc |
Source: Public Records
Mortgage History
| Date | Status | Borrower | Loan Amount |
|---|---|---|---|
| Open | Smith Jacob H | $335,000 | |
| Previous Owner | Smith Jacob H | $241,870 |
Source: Public Records
Tax History
| Year | Tax Paid | Tax Assessment Tax Assessment Total Assessment is a certain percentage of the fair market value that is determined by local assessors to be the total taxable value of land and additions on the property. | Land | Improvement |
|---|---|---|---|---|
| 2025 | $3,272 | $431,530 | -- | -- |
| 2024 | $3,272 | $390,390 | $0 | $0 |
| 2023 | $3,174 | $387,750 | $0 | $0 |
| 2022 | $3,476 | $422,620 | $0 | $0 |
| 2021 | $2,893 | $535,500 | $172,900 | $362,600 |
| 2020 | $2,750 | $499,000 | $160,100 | $338,900 |
| 2019 | $2,366 | $443,900 | $149,200 | $294,700 |
| 2018 | $2,376 | $421,500 | $145,500 | $276,000 |
| 2017 | $2,391 | $225,830 | $0 | $0 |
| 2016 | $2,428 | $221,430 | $0 | $0 |
| 2015 | $2,418 | $208,835 | $0 | $0 |
| 2014 | $2,324 | $198,825 | $0 | $0 |
Source: Public Records
Map
Nearby Homes
- 1186 N 300 E
- 1231 N 380 E Unit 9
- 1231 N 380 E
- 1234 N 300 E Unit 14
- 1234 N 300 E Unit 11
- 1234 N 300 E
- 1213 N 300 E Unit 22
- 1213 N 300 E
- 1239 N 380 E
- 1189 N 300 E
- 1189 N 300 E Unit 23
- 1223 N 380 E Unit 8
- 1164 N 300 E Unit 3
- 1164 N 300 E Unit 2
- 1164 N 300 E Unit 1
- 1165 N 300 E Unit 24
- 287 E 1220 N
- 1218 N 250 E Unit 21
- 1218 N 250 E
- 1192 N 250 E Unit 20
Your Personal Tour Guide
Ask me questions while you tour the home.