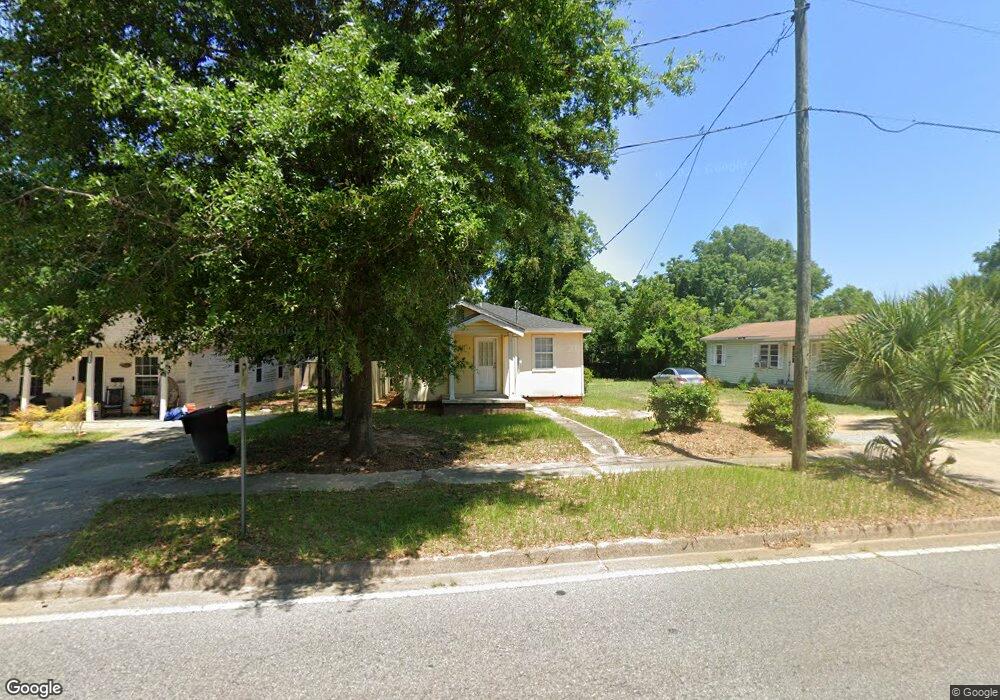
1212 N E St Pensacola, FL 32501
Estimated Value: $103,000 - $259,000
--
Bed
--
Bath
1,245
Sq Ft
$142/Sq Ft
Est. Value
About This Home
This home is located at 1212 N E St, Pensacola, FL 32501 and is currently estimated at $177,068, approximately $142 per square foot. 1212 N E St is a home located in Escambia County with nearby schools including Warrington Middle School, Pensacola High School, and Escambia Christian School.
Ownership History
Date
Name
Owned For
Owner Type
Purchase Details
Closed on
Jun 20, 2008
Sold by
Baker John W and Baker Karen A
Bought by
Towns Inc
Current Estimated Value
Home Financials for this Owner
Home Financials are based on the most recent Mortgage that was taken out on this home.
Original Mortgage
$46,000
Interest Rate
6%
Mortgage Type
Seller Take Back
Purchase Details
Closed on
May 2, 2007
Sold by
White Zollie and White Mecie
Bought by
Eagle Rock Properties Llc
Home Financials for this Owner
Home Financials are based on the most recent Mortgage that was taken out on this home.
Original Mortgage
$55,000
Interest Rate
6.1%
Mortgage Type
Balloon
Create a Home Valuation Report for This Property
The Home Valuation Report is an in-depth analysis detailing your home's value as well as a comparison with similar homes in the area
Home Values in the Area
Average Home Value in this Area
Purchase History
| Date | Buyer | Sale Price | Title Company |
|---|---|---|---|
| Towns Inc | $26,000 | First American Title Ins Co | |
| Eagle Rock Properties Llc | $20,000 | Gulf Title Company |
Source: Public Records
Mortgage History
| Date | Status | Borrower | Loan Amount |
|---|---|---|---|
| Closed | Towns Inc | $46,000 | |
| Previous Owner | Eagle Rock Properties Llc | $55,000 |
Source: Public Records
Tax History Compared to Growth
Tax History
| Year | Tax Paid | Tax Assessment Tax Assessment Total Assessment is a certain percentage of the fair market value that is determined by local assessors to be the total taxable value of land and additions on the property. | Land | Improvement |
|---|---|---|---|---|
| 2024 | $1,687 | $118,990 | $34,313 | $84,677 |
| 2023 | $1,687 | $89,026 | $0 | $0 |
| 2022 | $1,461 | $86,774 | $15,250 | $71,524 |
| 2021 | $1,339 | $74,204 | $0 | $0 |
| 2020 | $1,201 | $66,888 | $0 | $0 |
| 2019 | $1,149 | $63,445 | $0 | $0 |
| 2018 | $1,093 | $59,241 | $0 | $0 |
| 2017 | $1,053 | $55,979 | $0 | $0 |
| 2016 | $1,043 | $54,668 | $0 | $0 |
| 2015 | $1,026 | $53,043 | $0 | $0 |
| 2014 | $1,009 | $51,647 | $0 | $0 |
Source: Public Records
Map
Nearby Homes