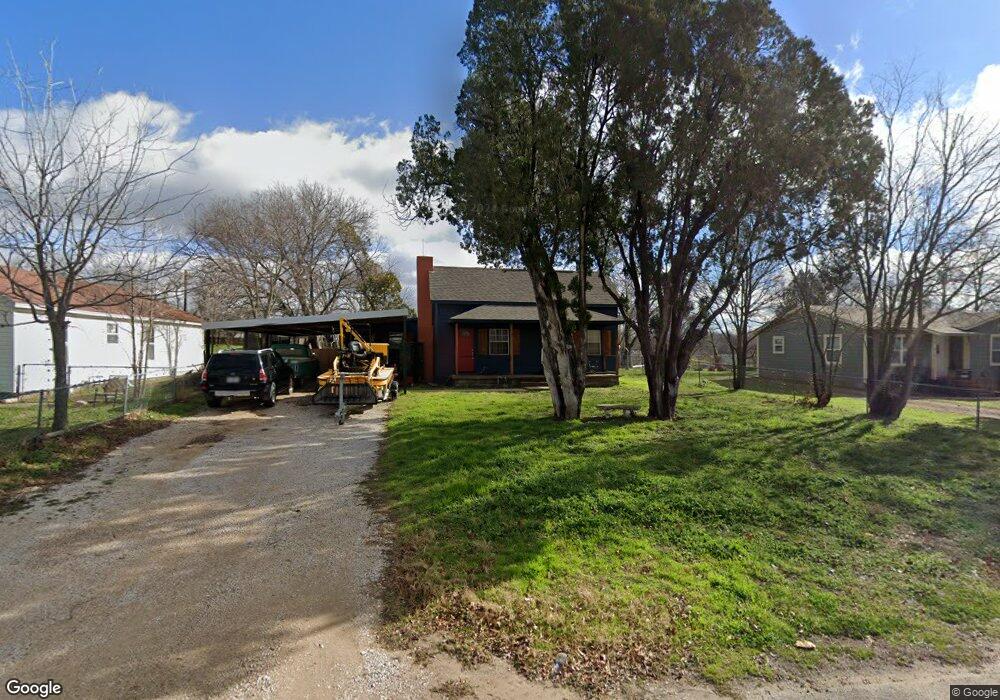
1212 N Rusk St Weatherford, TX 76086
Estimated Value: $233,494 - $282,000
--
Bed
--
Bath
1,324
Sq Ft
$198/Sq Ft
Est. Value
About This Home
This home is located at 1212 N Rusk St, Weatherford, TX 76086 and is currently estimated at $261,624, approximately $197 per square foot. 1212 N Rusk St is a home located in Parker County with nearby schools including Seguin Elementary School, Tison Middle School, and Weatherford High School.
Ownership History
Date
Name
Owned For
Owner Type
Purchase Details
Closed on
Apr 10, 2025
Sold by
Williams V Sam R
Bought by
Hamerman Aaron
Current Estimated Value
Purchase Details
Closed on
Jun 15, 2007
Sold by
Burks David G and Burks Buffy A
Bought by
Williams V Sam R
Home Financials for this Owner
Home Financials are based on the most recent Mortgage that was taken out on this home.
Original Mortgage
$68,426
Interest Rate
6.16%
Mortgage Type
FHA
Purchase Details
Closed on
Mar 2, 1993
Bought by
Williams Sam R V
Purchase Details
Closed on
Sep 5, 1985
Bought by
Williams Sam R V
Create a Home Valuation Report for This Property
The Home Valuation Report is an in-depth analysis detailing your home's value as well as a comparison with similar homes in the area
Home Values in the Area
Average Home Value in this Area
Purchase History
| Date | Buyer | Sale Price | Title Company |
|---|---|---|---|
| Hamerman Aaron | -- | None Listed On Document | |
| Williams V Sam R | -- | Rtt | |
| Williams Sam R V | -- | -- | |
| Williams Sam R V | -- | -- |
Source: Public Records
Mortgage History
| Date | Status | Borrower | Loan Amount |
|---|---|---|---|
| Previous Owner | Williams V Sam R | $68,426 |
Source: Public Records
Tax History Compared to Growth
Tax History
| Year | Tax Paid | Tax Assessment Tax Assessment Total Assessment is a certain percentage of the fair market value that is determined by local assessors to be the total taxable value of land and additions on the property. | Land | Improvement |
|---|---|---|---|---|
| 2025 | $4,607 | $293,650 | $50,000 | $243,650 |
| 2024 | $4,607 | $239,010 | $40,000 | $199,010 |
| 2023 | $4,607 | $239,010 | $40,000 | $199,010 |
| 2022 | $2,487 | $112,140 | $15,000 | $97,140 |
| 2021 | $2,693 | $112,140 | $15,000 | $97,140 |
| 2020 | $2,378 | $98,430 | $15,000 | $83,430 |
| 2019 | $2,514 | $98,430 | $15,000 | $83,430 |
| 2018 | $2,203 | $85,880 | $15,000 | $70,880 |
| 2017 | $2,260 | $85,880 | $15,000 | $70,880 |
| 2016 | $1,915 | $72,790 | $15,000 | $57,790 |
| 2015 | $1,876 | $72,790 | $15,000 | $57,790 |
| 2014 | $1,668 | $66,430 | $15,000 | $51,430 |
Source: Public Records
Map
Nearby Homes