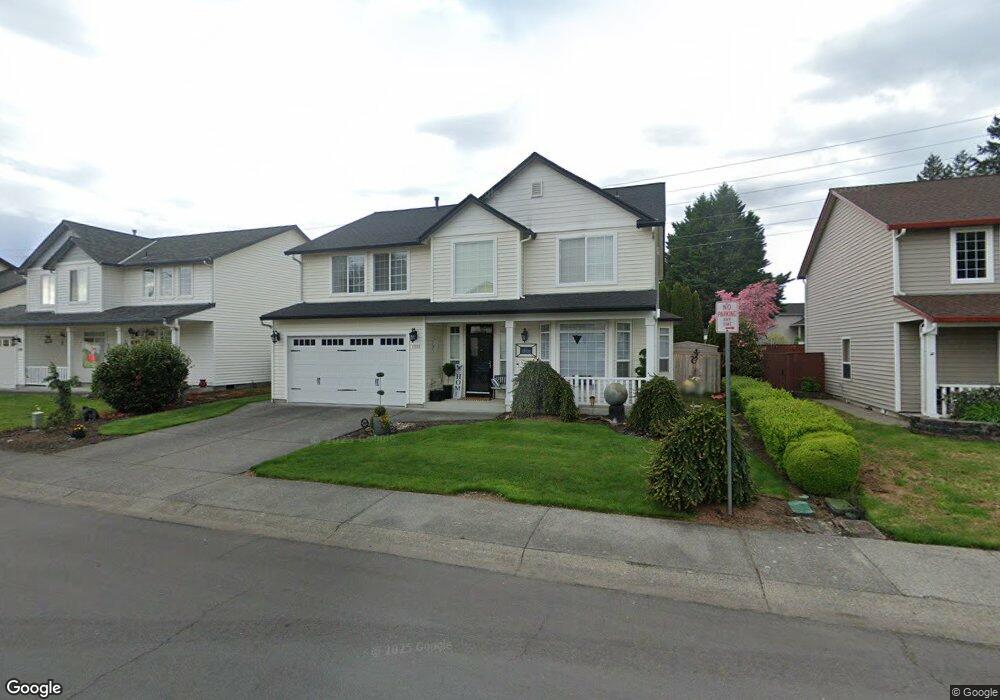
1212 NE 167th Ave Vancouver, WA 98684
Mill Plain NeighborhoodEstimated Value: $613,000 - $650,000
4
Beds
3
Baths
2,922
Sq Ft
$216/Sq Ft
Est. Value
About This Home
This home is located at 1212 NE 167th Ave, Vancouver, WA 98684 and is currently estimated at $632,442, approximately $216 per square foot. 1212 NE 167th Ave is a home located in Clark County with nearby schools including Illahee Elementary School, Shahala Middle School, and Union High School.
Ownership History
Date
Name
Owned For
Owner Type
Purchase Details
Closed on
Jan 17, 2007
Sold by
Petre Mihai and Petre Daniela
Bought by
Jones Calvin S and Jones Karen Y
Current Estimated Value
Home Financials for this Owner
Home Financials are based on the most recent Mortgage that was taken out on this home.
Original Mortgage
$358,000
Outstanding Balance
$285,141
Interest Rate
6.09%
Mortgage Type
Purchase Money Mortgage
Estimated Equity
$347,301
Purchase Details
Closed on
Nov 8, 2001
Sold by
Petre Daniela
Bought by
Petre Mihai and Petre Daniela
Home Financials for this Owner
Home Financials are based on the most recent Mortgage that was taken out on this home.
Original Mortgage
$172,800
Interest Rate
6.62%
Purchase Details
Closed on
Sep 25, 2000
Sold by
Petre Mihal
Bought by
Petre Daniela
Create a Home Valuation Report for This Property
The Home Valuation Report is an in-depth analysis detailing your home's value as well as a comparison with similar homes in the area
Home Values in the Area
Average Home Value in this Area
Purchase History
| Date | Buyer | Sale Price | Title Company |
|---|---|---|---|
| Jones Calvin S | $358,000 | Chicago Title Insurance Co | |
| Petre Mihai | -- | Chicago Title Insurance | |
| Petre Daniela | -- | First American Title Ins Co | |
| Petre Daniela | -- | First American Title Ins Co |
Source: Public Records
Mortgage History
| Date | Status | Borrower | Loan Amount |
|---|---|---|---|
| Open | Jones Calvin S | $358,000 | |
| Previous Owner | Petre Mihai | $172,800 | |
| Closed | Petre Mihai | $32,400 |
Source: Public Records
Tax History Compared to Growth
Tax History
| Year | Tax Paid | Tax Assessment Tax Assessment Total Assessment is a certain percentage of the fair market value that is determined by local assessors to be the total taxable value of land and additions on the property. | Land | Improvement |
|---|---|---|---|---|
| 2025 | $5,750 | $570,390 | $189,000 | $381,390 |
| 2024 | $5,657 | $569,139 | $189,000 | $380,139 |
| 2023 | $5,591 | $587,058 | $189,000 | $398,058 |
| 2022 | $5,060 | $571,191 | $182,250 | $388,941 |
| 2021 | $4,719 | $481,426 | $153,900 | $327,526 |
| 2020 | $4,697 | $422,293 | $135,000 | $287,293 |
| 2019 | $4,177 | $422,259 | $135,100 | $287,159 |
| 2018 | $4,478 | $405,304 | $0 | $0 |
| 2017 | $4,189 | $350,507 | $0 | $0 |
| 2016 | $3,926 | $342,078 | $0 | $0 |
| 2015 | $3,791 | $298,424 | $0 | $0 |
| 2014 | -- | $274,289 | $0 | $0 |
| 2013 | -- | $243,867 | $0 | $0 |
Source: Public Records
Map
Nearby Homes
- 16506 NE 13th St
- 1016 NE 163rd Ave
- 16209 NE 11th St
- 1111 NE 171st Ct
- 16525 NE 20th St
- 16115 NE 8th St
- 17006 NE 6th St
- 16500 SE 1st St
- 16500 SE 1st St Unit 14
- 16500 SE 1st St Unit 170
- 16500 SE 1st St Unit 44
- 16500 SE 1st St Unit 98
- 16500 SE 1st St Unit 144
- 16500 SE 1st St Unit 68
- 16500 SE 1st St Unit 46
- 16318 NE 20th St
- 16306 NE 20th St
- 16327 NE 21st St
- 16715 NE 5th St
- 419 NE 169th Ave
- 1208 NE 167th Ave
- 1302 NE 167th Ave
- 1306 NE 167th Ave
- 1204 NE 167th Ave
- 16703 NE 13th Cir
- 1219 NE 166th Ave
- 1217 NE 166th Ave
- 1221 NE 166th Ave
- 16700 NE 12th St
- 1215 NE 166th Ave
- 16707 NE 13th Cir
- 1211 NE 166th Ave
- 16706 NE 13th Cir
- 16704 NE 12th St
- 16520 NE 13th St
- 1118 NE 167th Ave
- 1207 NE 166th Ave
- 16711 NE 13th Cir
- 16710 NE 13th Cir
- 16518 NE 13th St