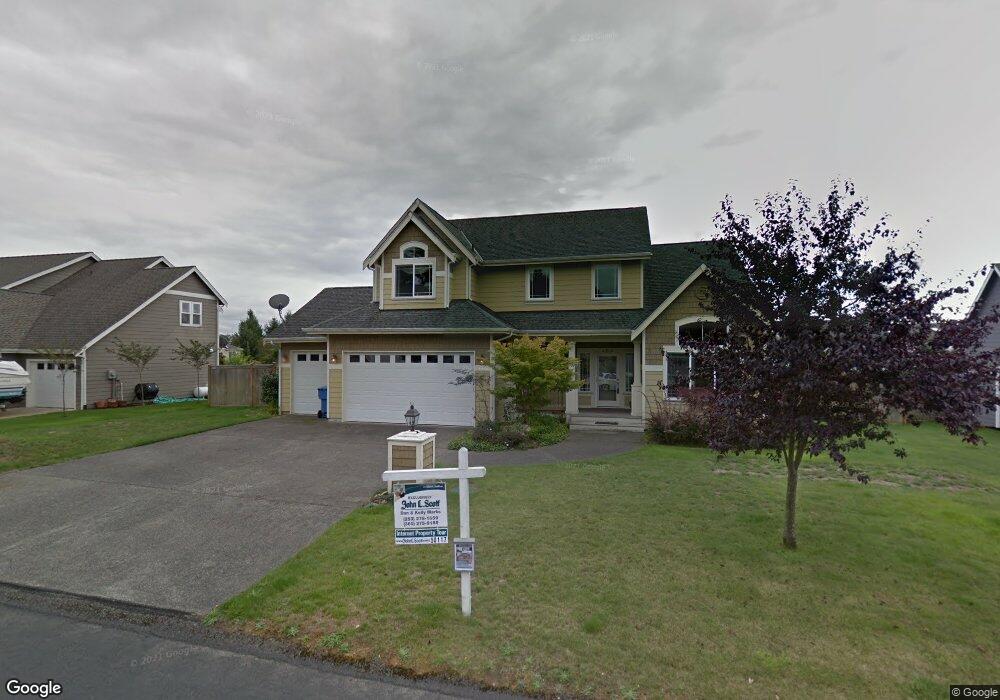
1212 Pilchuck Place Fi Fox Island, WA 98333
Estimated Value: $750,198 - $911,000
3
Beds
3
Baths
2,200
Sq Ft
$369/Sq Ft
Est. Value
About This Home
This home is located at 1212 Pilchuck Place Fi, Fox Island, WA 98333 and is currently estimated at $811,800, approximately $369 per square foot. 1212 Pilchuck Place Fi is a home located in Pierce County with nearby schools including Voyager Elementary School, Kopachuck Middle School, and Gig Harbor High School.
Ownership History
Date
Name
Owned For
Owner Type
Purchase Details
Closed on
Mar 21, 2014
Sold by
Lerman Edward and Lerman Karen
Bought by
Larsen Haava L and Larsen Kyle J
Current Estimated Value
Home Financials for this Owner
Home Financials are based on the most recent Mortgage that was taken out on this home.
Original Mortgage
$236,000
Outstanding Balance
$178,266
Interest Rate
4.25%
Mortgage Type
New Conventional
Estimated Equity
$633,534
Purchase Details
Closed on
Aug 25, 2009
Sold by
Diloreto Jason M
Bought by
Diloreto Sarah
Purchase Details
Closed on
Nov 14, 2002
Sold by
Waters William A
Bought by
I M Eagle Construction Inc
Home Financials for this Owner
Home Financials are based on the most recent Mortgage that was taken out on this home.
Original Mortgage
$208,050
Interest Rate
5.95%
Mortgage Type
Construction
Create a Home Valuation Report for This Property
The Home Valuation Report is an in-depth analysis detailing your home's value as well as a comparison with similar homes in the area
Home Values in the Area
Average Home Value in this Area
Purchase History
| Date | Buyer | Sale Price | Title Company |
|---|---|---|---|
| Larsen Haava L | $294,719 | Rainier Title | |
| Diloreto Sarah | -- | None Available | |
| I M Eagle Construction Inc | $48,200 | Commonwealth Title Co |
Source: Public Records
Mortgage History
| Date | Status | Borrower | Loan Amount |
|---|---|---|---|
| Open | Larsen Haava L | $236,000 | |
| Previous Owner | I M Eagle Construction Inc | $208,050 |
Source: Public Records
Tax History Compared to Growth
Tax History
| Year | Tax Paid | Tax Assessment Tax Assessment Total Assessment is a certain percentage of the fair market value that is determined by local assessors to be the total taxable value of land and additions on the property. | Land | Improvement |
|---|---|---|---|---|
| 2025 | $6,257 | $736,300 | $257,100 | $479,200 |
| 2024 | $6,257 | $696,100 | $243,500 | $452,600 |
| 2023 | $6,257 | $653,700 | $216,500 | $437,200 |
| 2022 | $5,341 | $667,300 | $216,500 | $450,800 |
| 2021 | $5,069 | $457,300 | $138,700 | $318,600 |
| 2019 | $4,636 | $448,000 | $125,500 | $322,500 |
| 2018 | $4,743 | $428,000 | $115,000 | $313,000 |
| 2017 | $4,072 | $400,200 | $104,600 | $295,600 |
| 2016 | $3,565 | $317,800 | $71,800 | $246,000 |
| 2014 | $3,234 | $290,500 | $67,600 | $222,900 |
| 2013 | $3,234 | $251,100 | $47,500 | $203,600 |
Source: Public Records
Map
Nearby Homes
- 1214 Pilchuck Way
- 1235 Pilchuck Dr
- 1130 Queets Dr
- 1350 Pilchuck Way
- 1341 Pilchuck Way
- 1090 Paha View Dr
- 1268 Pilchuck Dr
- 1112 Neah Dr
- 1043 Nootka Dr
- 1125 Neah Dr
- 1239 Nooksack Dr
- 1099 Makah Place
- 1037 9 Ave
- 4403 Paradise Ave W
- 9807 Bristonwood Dr W Unit 1B
- 4724 97th Ave W Unit 3A
- 1022 7th Ct
- 4501 Grandview Dr W Unit T208
- 4501 Grandview Dr W Unit T105
- 9418 Rock Rd W
- 1212 Pilchuck Way
- 1214 Pilchuck Place Fi
- 1210 Pilchuck Place Fi
- 1210 Pilchuck Way
- 1235 Queets Drive Fi
- 1235 Queets Dr
- 1241 Queets Dr
- 1229 Queets Dr
- 1229 Queets Drive Fi
- 1241 Queets Drive Fi
- 1213 Pilchuck Way
- 1213 Pilchuck Way
- 1213 Pilchuck Place Fi
- 1211 Pilchuck Place
- 1211 Pilchuck Place Fi
- 1211 Pilchuck Place
- 1216 Pilchuck Place Fi
- 1206 Pilchuck Place Fi
- 1558 13th Ave
- 1558 13th Avenue Fi