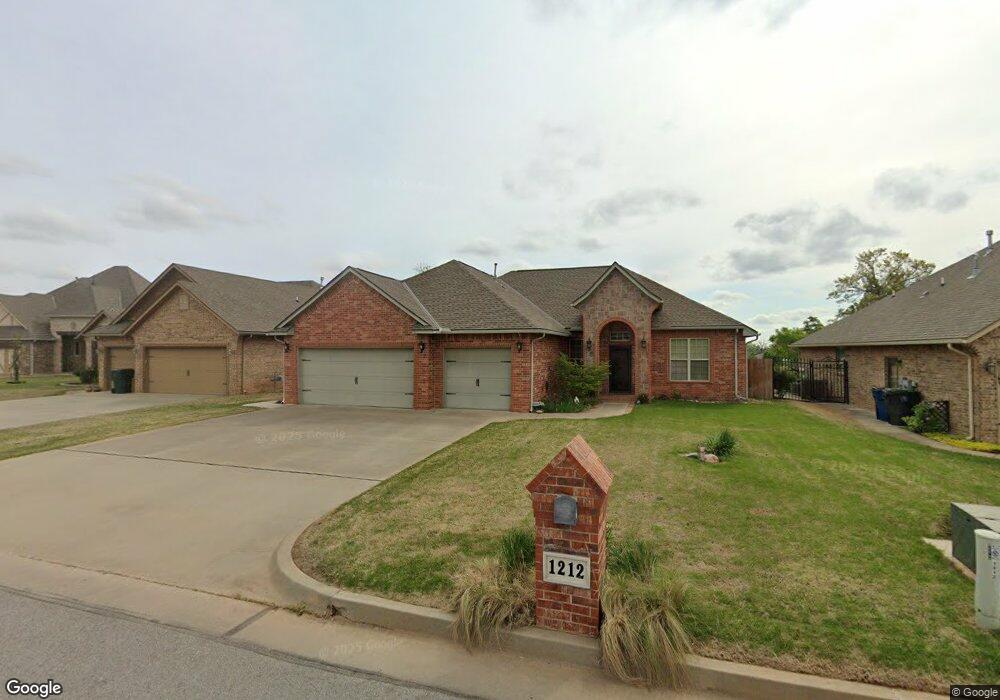
1212 Riverwind Dr Oklahoma City, OK 73130
Estimated Value: $289,586 - $340,000
3
Beds
2
Baths
1,975
Sq Ft
$162/Sq Ft
Est. Value
About This Home
This home is located at 1212 Riverwind Dr, Oklahoma City, OK 73130 and is currently estimated at $320,397, approximately $162 per square foot. 1212 Riverwind Dr is a home located in Oklahoma County with nearby schools including Nicoma Park Elementary School, Nicoma Park Intermediate Elementary School, and Nicoma Park Middle School.
Ownership History
Date
Name
Owned For
Owner Type
Purchase Details
Closed on
May 15, 2020
Sold by
Gilbert Lena Amanda and Moore Craig Allen
Bought by
Moore Lena Amanda and Moore Craig Allen
Current Estimated Value
Purchase Details
Closed on
Dec 30, 2010
Sold by
Fraze Enterprises Inc
Bought by
Gilbert Lena A
Home Financials for this Owner
Home Financials are based on the most recent Mortgage that was taken out on this home.
Original Mortgage
$190,475
Outstanding Balance
$127,541
Interest Rate
4.41%
Mortgage Type
New Conventional
Estimated Equity
$192,856
Purchase Details
Closed on
Mar 25, 2010
Sold by
Midland Development Group Llc
Bought by
Fraze Enterprises Inc
Home Financials for this Owner
Home Financials are based on the most recent Mortgage that was taken out on this home.
Original Mortgage
$157,690
Interest Rate
4.93%
Mortgage Type
Construction
Create a Home Valuation Report for This Property
The Home Valuation Report is an in-depth analysis detailing your home's value as well as a comparison with similar homes in the area
Home Values in the Area
Average Home Value in this Area
Purchase History
| Date | Buyer | Sale Price | Title Company |
|---|---|---|---|
| Moore Lena Amanda | -- | Os Title Co | |
| Gilbert Lena A | $200,500 | Landrun Title & Closing Co | |
| Fraze Enterprises Inc | $32,000 | Stewart Escrow & Title Midwe |
Source: Public Records
Mortgage History
| Date | Status | Borrower | Loan Amount |
|---|---|---|---|
| Open | Gilbert Lena A | $190,475 | |
| Previous Owner | Fraze Enterprises Inc | $157,690 |
Source: Public Records
Tax History Compared to Growth
Tax History
| Year | Tax Paid | Tax Assessment Tax Assessment Total Assessment is a certain percentage of the fair market value that is determined by local assessors to be the total taxable value of land and additions on the property. | Land | Improvement |
|---|---|---|---|---|
| 2024 | $3,146 | $26,246 | $4,683 | $21,563 |
| 2023 | $3,146 | $25,482 | $3,721 | $21,761 |
| 2022 | $3,020 | $24,739 | $4,099 | $20,640 |
| 2021 | $2,916 | $24,019 | $4,400 | $19,619 |
| 2020 | $2,850 | $23,320 | $4,674 | $18,646 |
| 2019 | $2,874 | $23,760 | $4,574 | $19,186 |
| 2018 | $2,684 | $23,430 | $0 | $0 |
| 2017 | $2,662 | $23,264 | $4,574 | $18,690 |
| 2016 | $2,612 | $22,659 | $4,574 | $18,085 |
| 2015 | $2,665 | $22,327 | $4,464 | $17,863 |
| 2014 | $2,623 | $21,893 | $4,464 | $17,429 |
Source: Public Records
Map
Nearby Homes
- 1104 Victor Ct
- 10820 Ohara Ln
- 10800 SE 9th St
- 1301 Grand Manor
- 10505 Willow Ridge Dr
- 0 SE 15th St
- 1501 S Avery Ave
- 1917 Goldenrod Ln
- 1972 Leslie Beachler Ln
- 000 Tbd Bellview Dr
- 10323 Haven Cir
- 10305 Saint Patrick Dr
- 11423 Village Ave
- 10236 Bellmont Ave
- 10553 SE 23rd St
- 11101 E Reno Ave
- 2301 S Westminster Rd
- 10107 Saint Patrick Dr
- 313 Remington Ave
- 104 Stone Creek Rd
- 1216 Riverwind Dr
- 1208 Riverwind Dr
- 1213 Tara Dr
- 1217 Tara Dr
- 1300 Riverwind Dr
- 1209 Tara Dr
- 1301 Tara Dr
- 1204 Riverwind Dr
- 1217 Riverwind Dr
- 1304 Riverwind Dr
- 1305 Tara Dr
- 1205 Tara Dr
- 1209 Riverwind Dr
- 0 Tract 17 Unit 475682
- 0 Tract 'B' Roefan
- 1301 Riverwind Dr
- 1200 Riverwind Dr
- 1309 Tara Dr
- 1205 Riverwind Dr
- 1308 Riverwind Dr