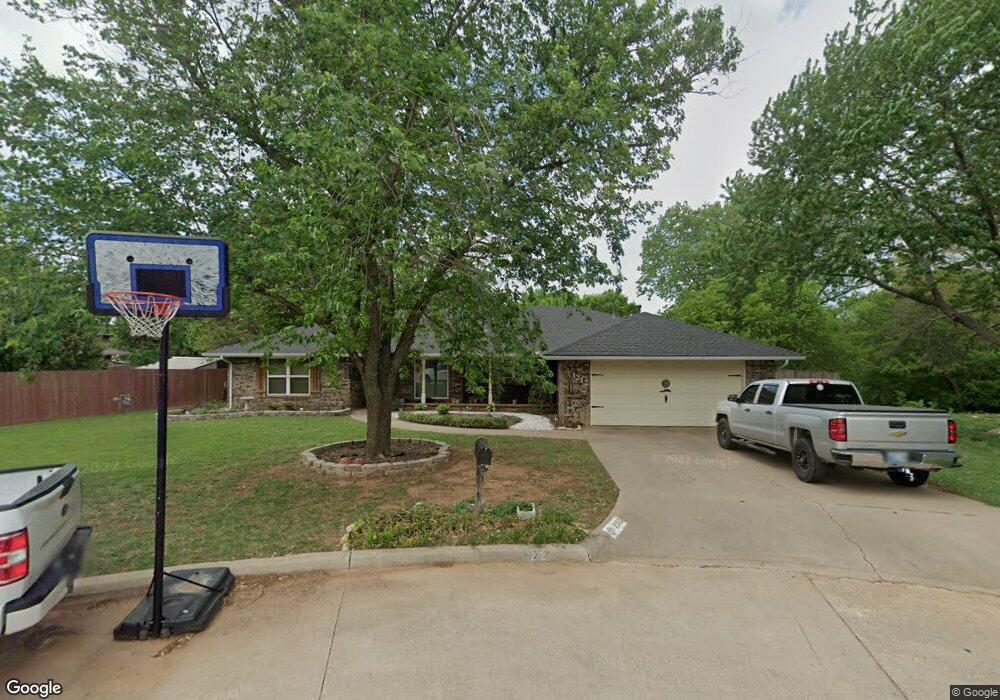
1212 W Randall Ct Duncan, OK 73533
Estimated Value: $181,000 - $211,000
3
Beds
2
Baths
1,874
Sq Ft
$105/Sq Ft
Est. Value
About This Home
This home is located at 1212 W Randall Ct, Duncan, OK 73533 and is currently estimated at $196,078, approximately $104 per square foot. 1212 W Randall Ct is a home located in Stephens County with nearby schools including Horace Mann Elementary School, Duncan Middle School, and Duncan High School.
Ownership History
Date
Name
Owned For
Owner Type
Purchase Details
Closed on
Mar 31, 2017
Sold by
Ford Shana E and Ford James C
Bought by
Varner Mary Jane and Varner Ronnie
Current Estimated Value
Home Financials for this Owner
Home Financials are based on the most recent Mortgage that was taken out on this home.
Original Mortgage
$97,000
Outstanding Balance
$80,393
Interest Rate
4.15%
Mortgage Type
New Conventional
Estimated Equity
$115,685
Purchase Details
Closed on
Sep 20, 2013
Sold by
Stewart Ivan Robert and Stewart Mary F
Bought by
Ford James C and Ford Shana E
Purchase Details
Closed on
Sep 3, 2013
Sold by
Hepburn Kristy and Hepburn Billy
Purchase Details
Closed on
Aug 16, 2013
Sold by
White Mary Fern
Purchase Details
Closed on
Sep 11, 2012
Sold by
Stewart Maryfern and Stewart Ivan R
Bought by
Ford Shana and Ford James C
Purchase Details
Closed on
Mar 10, 2012
Sold by
White Maryfern
Purchase Details
Closed on
Aug 5, 2010
Sold by
White Maryferm
Bought by
The Ivan Robert & Mary Fern Stewart Livi
Create a Home Valuation Report for This Property
The Home Valuation Report is an in-depth analysis detailing your home's value as well as a comparison with similar homes in the area
Home Values in the Area
Average Home Value in this Area
Purchase History
| Date | Buyer | Sale Price | Title Company |
|---|---|---|---|
| Varner Mary Jane | $122,000 | None Available | |
| Ford James C | $120,500 | -- | |
| -- | -- | -- | |
| -- | -- | -- | |
| Ford Shana | $120,300 | None Available | |
| -- | -- | -- | |
| The Ivan Robert & Mary Fern Stewart Livi | -- | None Available |
Source: Public Records
Mortgage History
| Date | Status | Borrower | Loan Amount |
|---|---|---|---|
| Open | Varner Mary Jane | $97,000 |
Source: Public Records
Tax History Compared to Growth
Tax History
| Year | Tax Paid | Tax Assessment Tax Assessment Total Assessment is a certain percentage of the fair market value that is determined by local assessors to be the total taxable value of land and additions on the property. | Land | Improvement |
|---|---|---|---|---|
| 2025 | $1,190 | $15,424 | $1,463 | $13,961 |
| 2024 | $1,190 | $14,974 | $1,463 | $13,511 |
| 2023 | $1,190 | $14,975 | $1,463 | $13,512 |
| 2022 | $1,115 | $14,538 | $1,463 | $13,075 |
| 2021 | $1,081 | $13,704 | $1,463 | $12,241 |
| 2020 | $1,088 | $13,597 | $1,463 | $12,134 |
| 2019 | $1,056 | $13,201 | $1,463 | $11,738 |
| 2018 | $1,121 | $13,583 | $1,463 | $12,120 |
| 2017 | $1,200 | $14,049 | $1,463 | $12,586 |
| 2016 | $1,045 | $13,295 | $1,463 | $11,832 |
| 2015 | $1,054 | $13,295 | $1,463 | $11,832 |
| 2014 | $1,054 | $13,295 | $1,463 | $11,832 |
Source: Public Records
Map
Nearby Homes
- 2230 W Spruce St
- 2204 W Parkview Ave
- 2206 2206 W Spruce
- 1929 W Chisholm Dr
- 2110 W Amhurst Ave
- 2202 W Canary Ave
- 1212 1212 N 21st
- 1302 N 21st St
- 507 N Alice Dr
- 1311 1311 N 20 St
- 2210 Western Dr
- 2120 2120 Flamingo Ln
- 1902 W Randall Ave
- 1099 N 19th St
- 1244 Carriage Dr
- 2150 Drexal Place
- 1807 W Chisholm Dr
- 1385 Smith Rd
- 1359 Smith Rd
- 3421 Salter St
- 2407 W Randall Ave
- 2409 W Randall Ave
- 1210 W Randall Ct
- 1204 W Randall Ct
- 1204 1204 Randall Ct
- 1208 W Randall Ct
- 1208 W Randall Ct
- 1206 W Randall Ct
- 1202 W Randall Ct
- 1123 N Primrose St
- 2406 W Randall Ave
- 1211 N Harville Rd
- 2404 W Randall Ave
- 1205 1205 Harville
- 1205 N Harville Rd
- 1203 N Harville Rd
- 1213 N Harville Rd
- 1207 N Harville Rd
- 1201 N Harville Rd
- 2302 W Randall Ave