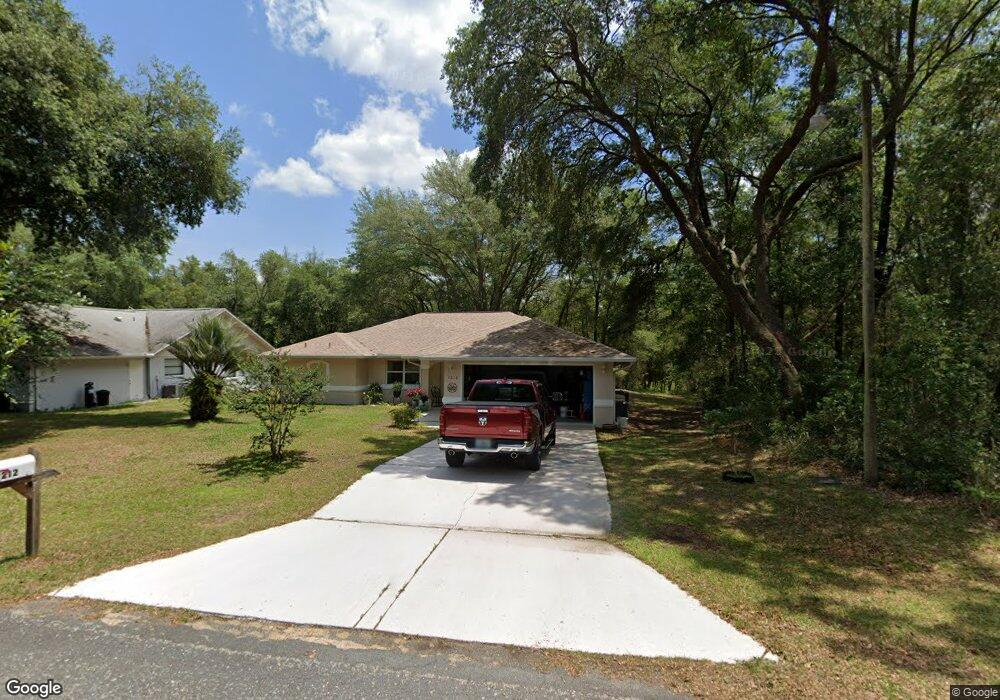
1212 W Virginis Dr Unit 1 Citrus Springs, FL 34434
Estimated Value: $233,335 - $309,000
3
Beds
2
Baths
1,634
Sq Ft
$167/Sq Ft
Est. Value
About This Home
This home is located at 1212 W Virginis Dr Unit 1, Citrus Springs, FL 34434 and is currently estimated at $273,334, approximately $167 per square foot. 1212 W Virginis Dr Unit 1 is a home located in Citrus County with nearby schools including Central Ridge Elementary School, Citrus Springs Middle School, and Citrus High School.
Ownership History
Date
Name
Owned For
Owner Type
Purchase Details
Closed on
Dec 21, 2023
Sold by
Vanwyck Wilbur D
Bought by
Wilbur Detester Vanwyck Trust
Current Estimated Value
Purchase Details
Closed on
Aug 11, 2017
Sold by
Guenthner Andrew
Bought by
Vanwyck Wilbur D
Purchase Details
Closed on
Feb 25, 2009
Sold by
Vanwyck Wilbur Delester
Bought by
Guenther Andrew
Home Financials for this Owner
Home Financials are based on the most recent Mortgage that was taken out on this home.
Original Mortgage
$91,920
Interest Rate
5.03%
Mortgage Type
Purchase Money Mortgage
Purchase Details
Closed on
Sep 7, 2001
Sold by
Vanwyck Wilbur Delester and The Ethel B Vanwyck Living Tru
Bought by
Vanwyck Wilbur Delester
Purchase Details
Closed on
Mar 1, 1997
Bought by
Vanwyck Wilbur D
Purchase Details
Closed on
Dec 1, 1995
Bought by
Vanwyck Wilbur D
Create a Home Valuation Report for This Property
The Home Valuation Report is an in-depth analysis detailing your home's value as well as a comparison with similar homes in the area
Home Values in the Area
Average Home Value in this Area
Purchase History
| Date | Buyer | Sale Price | Title Company |
|---|---|---|---|
| Wilbur Detester Vanwyck Trust | $100 | None Listed On Document | |
| Wilbur Detester Vanwyck Trust | $100 | None Listed On Document | |
| Vanwyck Wilbur D | $113,000 | Attorney | |
| Guenther Andrew | $114,900 | Attorney | |
| Vanwyck Wilbur Delester | -- | -- | |
| Vanwyck Wilbur D | $100 | -- | |
| Vanwyck Wilbur D | $3,500 | -- |
Source: Public Records
Mortgage History
| Date | Status | Borrower | Loan Amount |
|---|---|---|---|
| Previous Owner | Guenther Andrew | $91,920 |
Source: Public Records
Tax History Compared to Growth
Tax History
| Year | Tax Paid | Tax Assessment Tax Assessment Total Assessment is a certain percentage of the fair market value that is determined by local assessors to be the total taxable value of land and additions on the property. | Land | Improvement |
|---|---|---|---|---|
| 2024 | $2,616 | $183,997 | $8,800 | $175,197 |
| 2023 | $2,616 | $177,785 | $8,480 | $169,305 |
| 2022 | $2,314 | $160,193 | $7,280 | $152,913 |
| 2021 | $1,991 | $125,581 | $2,840 | $122,741 |
| 2020 | $1,827 | $118,745 | $3,220 | $115,525 |
| 2019 | $1,662 | $103,993 | $2,480 | $101,513 |
| 2018 | $1,539 | $95,178 | $2,480 | $92,698 |
| 2017 | $1,253 | $76,277 | $2,040 | $74,237 |
| 2016 | $1,252 | $78,303 | $2,980 | $75,323 |
| 2015 | $1,093 | $60,433 | $2,980 | $57,453 |
| 2014 | $1,206 | $65,000 | $1,567 | $63,433 |
Source: Public Records
Map
Nearby Homes
- 11017 N Easter Terrace
- 10982 N Academy Dr
- 0 W G Martinelli Blvd Unit 1801 MFRO6335849
- 405 W G Martinelli Blvd
- 11231 N Denice Point
- 1639 W G Martinelli Blvd
- 11067 N Glenda Terrace
- 11035 N Glenda Terrace
- 1435 W Adele Ct
- 1376 W Mosswood Ln
- 1425 W Mosswood Ln
- 11312 N Fuego Dr
- 11264 N Schult Terrace
- 11200 N Terra Cotta Dr
- 11400 N Terra Cotta Dr
- 10768 N Orva Dr
- 1599 W G Martinelli Blvd
- 1194 W Virginis Dr
- 800 W Virginis Dr
- 1547 W Magenta Dr
- 1212 W Virginis Dr
- 1208 W Virginis Dr
- 1215 W Virginis Dr
- 1219 W Virginis Dr
- 11161 N Easter Terrace
- 1201 W Virginis Dr
- 11176 N Easter Terrace
- 11192 N Easter Terrace
- 11119 N Easter Terrace
- 11131 N Easter Terrace
- 11193 N Easter Terrace
- 11182 N Ivonne Terrace
- 1197 W G Martinelli Blvd
- 1215 W G Martenelli Blvd
- 11123 N Ivonne Terrace
- 11109 N Ivonne Terrace Unit 18
- 11109 N Ivonne Terrace
- 11020 N Ivonne Terrace
- 1155 W Virginis Dr
- 1149 W Virginis