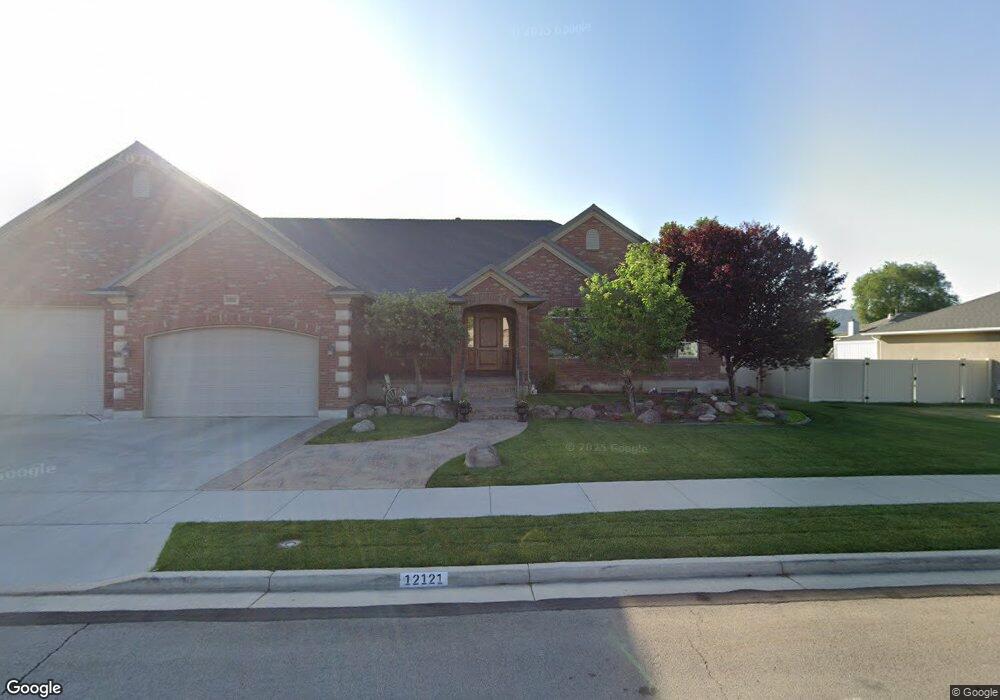
12121 Laurel Chase Dr Riverton, UT 84065
Estimated Value: $873,000 - $1,066,643
4
Beds
3
Baths
2,456
Sq Ft
$403/Sq Ft
Est. Value
About This Home
This home is located at 12121 Laurel Chase Dr, Riverton, UT 84065 and is currently estimated at $988,661, approximately $402 per square foot. 12121 Laurel Chase Dr is a home located in Salt Lake County with nearby schools including Rosamond Elementary School, Oquirrh Hills Middle School, and Riverton High School.
Ownership History
Date
Name
Owned For
Owner Type
Purchase Details
Closed on
Dec 28, 2020
Sold by
Bumirigharn Dale L and Burningham Lana S
Bought by
Burningham Dale L and Burningham Lana S
Current Estimated Value
Home Financials for this Owner
Home Financials are based on the most recent Mortgage that was taken out on this home.
Original Mortgage
$319,000
Outstanding Balance
$259,158
Interest Rate
2.7%
Mortgage Type
New Conventional
Estimated Equity
$729,503
Purchase Details
Closed on
Aug 17, 2009
Sold by
Burningham Dale L and Burningham Lana S
Bought by
Burningham Dale L and Burningham Lana S
Purchase Details
Closed on
Sep 9, 2003
Sold by
Hendrickson Marvin L
Bought by
Burningham Dale L and Burningham Lana S
Home Financials for this Owner
Home Financials are based on the most recent Mortgage that was taken out on this home.
Original Mortgage
$250,000
Interest Rate
5.87%
Mortgage Type
Purchase Money Mortgage
Create a Home Valuation Report for This Property
The Home Valuation Report is an in-depth analysis detailing your home's value as well as a comparison with similar homes in the area
Home Values in the Area
Average Home Value in this Area
Purchase History
| Date | Buyer | Sale Price | Title Company |
|---|---|---|---|
| Burningham Dale L | -- | Meridian Title | |
| Burningham Dale L | -- | Meridian Title | |
| Burningham Dale L | -- | None Available | |
| Burningham Dale L | -- | -- |
Source: Public Records
Mortgage History
| Date | Status | Borrower | Loan Amount |
|---|---|---|---|
| Open | Burningham Dale L | $319,000 | |
| Closed | Burningham Dale L | $250,000 |
Source: Public Records
Tax History Compared to Growth
Tax History
| Year | Tax Paid | Tax Assessment Tax Assessment Total Assessment is a certain percentage of the fair market value that is determined by local assessors to be the total taxable value of land and additions on the property. | Land | Improvement |
|---|---|---|---|---|
| 2025 | $5,718 | $1,017,400 | $285,000 | $732,400 |
| 2024 | $5,718 | $989,600 | $276,900 | $712,700 |
| 2023 | $5,824 | $950,300 | $271,400 | $678,900 |
| 2022 | $6,059 | $969,900 | $266,100 | $703,800 |
| 2021 | $5,255 | $748,900 | $225,600 | $523,300 |
| 2020 | $4,976 | $661,200 | $224,500 | $436,700 |
| 2019 | $4,958 | $647,700 | $221,000 | $426,700 |
| 2018 | $4,760 | $612,200 | $146,300 | $465,900 |
| 2017 | $4,607 | $577,500 | $146,300 | $431,200 |
| 2016 | $4,619 | $555,500 | $146,300 | $409,200 |
| 2015 | $4,433 | $516,900 | $167,500 | $349,400 |
| 2014 | $4,191 | $479,100 | $156,800 | $322,300 |
Source: Public Records
Map
Nearby Homes
- 1410 W 12115 S
- 12294 S 1490 W
- 1661 W Madison View Dr
- 12216 S 1300 W
- 12317 S Redwood Rd
- 12325 S Redwood Rd
- 12345 S Redwood Rd
- 1337 Natasha Cir
- 1056 W Kate Springs Ln S Unit 10
- 1721 W Hollow Cedar Ln Unit 1
- 12392 S 1300 W
- 1611 W Laurel Chase Dr
- 11860 S Alysum Cir
- 11784 Stone Ridge Ct
- 1184 W Margaret Rose Dr
- 12034 S 1900 W
- 1182 River Hills Dr
- 11711 Stone Crest Cir
- 1373 W Stewart Falls Dr
- 1371 W Stewart Falls Dr
- 12097 S Laurel Chase Dr
- 12097 Laurel Chase Dr
- 12133 Laurel Chase Dr
- 12122 S 1420 W
- 12122 Laurel Chase Dr
- 12122 S Laurel Chase Dr
- 12134 S Laurel Chase Dr
- 12174 Summit Hollow Cir
- 12174 S Summit Hollow Cir
- 12083 Laurel Chase Dr
- 12083 S Laurel Chase Dr
- 1518 Fiver Cir
- 12147 Laurel Chase Dr
- 12178 Summit Hollow Cir
- 12178 S Summit Hollow Cir
- 12108 S 1420 W
- 1533 Meadow Green Dr
- 1533 W Meadow Green Dr
- 12102 S 1420 W
- 1536 Fiver Cir