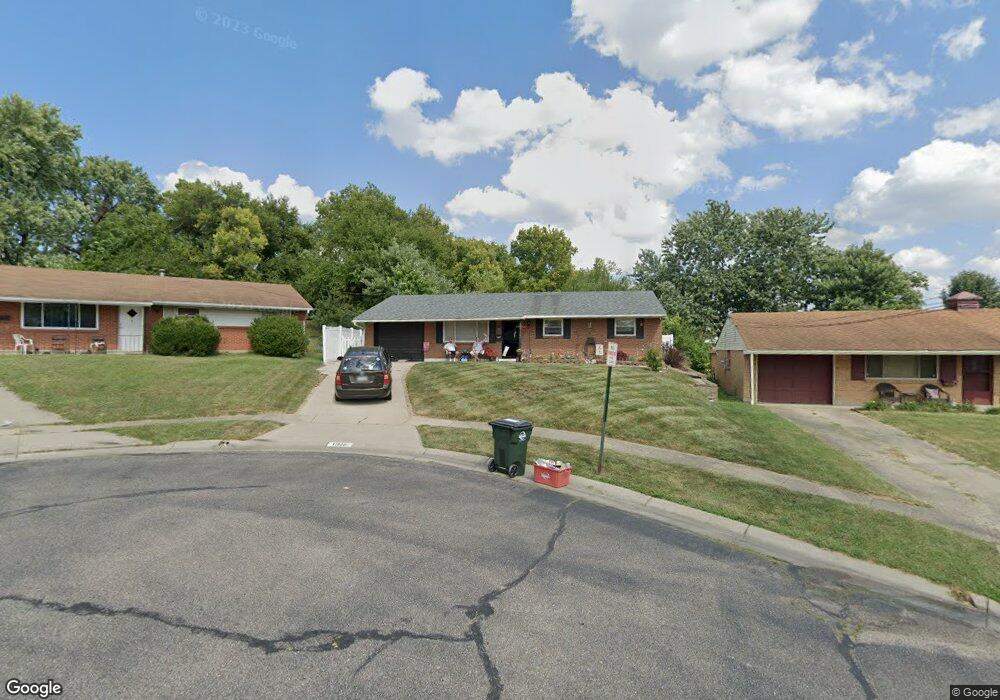
12122 Cornavin Ct Cincinnati, OH 45246
Estimated Value: $191,970 - $212,000
3
Beds
1
Bath
1,026
Sq Ft
$198/Sq Ft
Est. Value
About This Home
This home is located at 12122 Cornavin Ct, Cincinnati, OH 45246 and is currently estimated at $202,743, approximately $197 per square foot. 12122 Cornavin Ct is a home located in Hamilton County with nearby schools including Stewart Elementary School, Princeton Community Middle School, and Princeton High School.
Ownership History
Date
Name
Owned For
Owner Type
Purchase Details
Closed on
Oct 31, 2002
Sold by
Smith Steven R and Smith Melissa J
Bought by
Coffey Jonathan
Current Estimated Value
Home Financials for this Owner
Home Financials are based on the most recent Mortgage that was taken out on this home.
Original Mortgage
$105,070
Outstanding Balance
$42,609
Interest Rate
6.1%
Mortgage Type
FHA
Estimated Equity
$160,134
Purchase Details
Closed on
Oct 17, 1997
Sold by
Dickenherr Robert M
Bought by
Smith Steven R and Smith Melissa J
Home Financials for this Owner
Home Financials are based on the most recent Mortgage that was taken out on this home.
Original Mortgage
$84,918
Interest Rate
7.65%
Mortgage Type
FHA
Purchase Details
Closed on
Nov 10, 1993
Sold by
Dickenherr Karen L
Bought by
Dickenherr Robert M
Create a Home Valuation Report for This Property
The Home Valuation Report is an in-depth analysis detailing your home's value as well as a comparison with similar homes in the area
Home Values in the Area
Average Home Value in this Area
Purchase History
| Date | Buyer | Sale Price | Title Company |
|---|---|---|---|
| Coffey Jonathan | $105,900 | Park Place Title Agency | |
| Smith Steven R | $85,000 | -- | |
| Dickenherr Robert M | -- | -- |
Source: Public Records
Mortgage History
| Date | Status | Borrower | Loan Amount |
|---|---|---|---|
| Open | Coffey Jonathan | $105,070 | |
| Previous Owner | Smith Steven R | $84,918 |
Source: Public Records
Tax History
| Year | Tax Paid | Tax Assessment Tax Assessment Total Assessment is a certain percentage of the fair market value that is determined by local assessors to be the total taxable value of land and additions on the property. | Land | Improvement |
|---|---|---|---|---|
| 2025 | $2,359 | $47,044 | $10,920 | $36,124 |
| 2023 | $2,032 | $47,044 | $10,920 | $36,124 |
| 2022 | $1,682 | $31,669 | $8,481 | $23,188 |
| 2021 | $1,635 | $31,669 | $8,481 | $23,188 |
| 2020 | $1,656 | $31,669 | $8,481 | $23,188 |
| 2019 | $1,532 | $27,066 | $7,249 | $19,817 |
| 2018 | $1,441 | $27,066 | $7,249 | $19,817 |
| 2017 | $1,353 | $27,066 | $7,249 | $19,817 |
| 2016 | $1,503 | $29,852 | $7,847 | $22,005 |
| 2015 | $1,518 | $29,852 | $7,847 | $22,005 |
| 2014 | $1,523 | $29,852 | $7,847 | $22,005 |
| 2013 | $1,535 | $30,773 | $8,089 | $22,684 |
Source: Public Records
Map
Nearby Homes
- 1032 E Crescentville Rd
- 516 Salzberg Ln
- 1655 E Crescentville Rd
- 9578 Woodland Hills Dr Unit 9578
- 9586 Woodland Hills Dr
- 9553 Olde Woods Dr
- 9508 Woodland Hills Dr Unit 9508
- 9512 Woodland Hills Dr
- 5011 Columbia Cir
- 9489 Woodland Hills Dr Unit 9489
- 3 Rogan Dr
- 9477 Colegate Way Unit 247
- 290 Nelson Ln
- 9450 Crockett Pass Unit 9450A
- 9432 Deer Walk Ct
- 2 Clarke Ct
- 237 Eastwick Dr
- 5024 Rialto Ridge Dr
- 256 Centerbury Ct Unit 67
- 7 Creekwood Square Unit 7
- 12108 Cornavin Ct
- 12136 Cornavin Ct
- 914 Castro Ln
- 922 Castro Ln
- 904 Castro Ln
- 12149 Cornavin Ct
- 12135 Cornavin Ct
- 865 Tivoli Ln
- 877 Tivoli Ln
- 12121 Cornavin Ct
- 853 Tivoli Ln
- 940 Castro Ln
- 12107 Cornavin Ct
- 843 Tivoli Ln
- 887 Tivoli Ln
- 12095 Cornavin Ct
- 12068 Cornavin Ct
- 899 Tivoli Ln
- 831 Tivoli Ln
- 921 Castro Ln
Your Personal Tour Guide
Ask me questions while you tour the home.