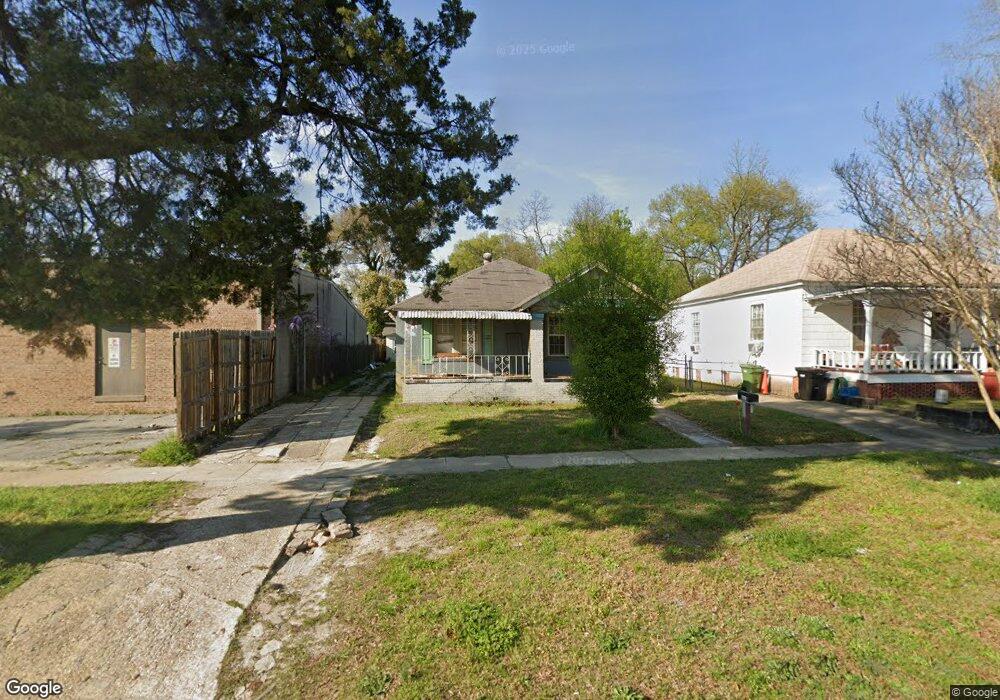
1213 21st St Columbus, GA 31901
East Highlands NeighborhoodEstimated Value: $103,377 - $168,000
4
Beds
3
Baths
1,200
Sq Ft
$104/Sq Ft
Est. Value
About This Home
This home is located at 1213 21st St, Columbus, GA 31901 and is currently estimated at $125,094, approximately $104 per square foot. 1213 21st St is a home located in Muscogee County with nearby schools including Arnold Middle School, Jordan Vocational High School, and Wynnton Elementary School.
Ownership History
Date
Name
Owned For
Owner Type
Purchase Details
Closed on
Sep 7, 2023
Sold by
Shlomi Zvi
Bought by
Wise Donald Wayne
Current Estimated Value
Purchase Details
Closed on
Jul 31, 2023
Sold by
Wise Donald W
Bought by
Wise Brian W
Purchase Details
Closed on
Nov 16, 2022
Sold by
Wise Brian
Bought by
Culbreath Kevin Joseph
Purchase Details
Closed on
Jun 2, 2020
Sold by
Tax Comm And Ex Officio Sheriff
Bought by
Shlomi Zvi and One Home Ahead 401L Plan
Create a Home Valuation Report for This Property
The Home Valuation Report is an in-depth analysis detailing your home's value as well as a comparison with similar homes in the area
Home Values in the Area
Average Home Value in this Area
Purchase History
| Date | Buyer | Sale Price | Title Company |
|---|---|---|---|
| Wise Donald Wayne | $15,037 | None Listed On Document | |
| Wise Brian W | -- | None Listed On Document | |
| Culbreath Kevin Joseph | -- | -- | |
| Shlomi Zvi | $6,650 | -- |
Source: Public Records
Tax History Compared to Growth
Tax History
| Year | Tax Paid | Tax Assessment Tax Assessment Total Assessment is a certain percentage of the fair market value that is determined by local assessors to be the total taxable value of land and additions on the property. | Land | Improvement |
|---|---|---|---|---|
| 2025 | $5,256 | $37,592 | $7,756 | $29,836 |
| 2024 | $3,282 | $41,068 | $7,756 | $33,312 |
| 2023 | $1,403 | $35,628 | $7,756 | $27,872 |
| 2022 | $1,175 | $28,772 | $7,756 | $21,016 |
| 2021 | $1,099 | $26,908 | $7,756 | $19,152 |
| 2020 | $1,099 | $26,908 | $7,756 | $19,152 |
| 2019 | $1,193 | $29,116 | $7,756 | $21,360 |
| 2018 | $1,112 | $27,140 | $7,756 | $19,384 |
| 2017 | $2,130 | $27,140 | $7,756 | $19,384 |
| 2016 | $991 | $24,020 | $2,600 | $21,420 |
| 2015 | $178 | $24,020 | $2,600 | $21,420 |
| 2014 | $178 | $24,020 | $2,600 | $21,420 |
| 2013 | -- | $24,020 | $2,600 | $21,420 |
Source: Public Records
Map
Nearby Homes