S
Seller's Agent in 2022
Sandy Anthony
Hometown Realty Of Sw Ga
(229) 347-2900
1 in this area
226 Total Sales
Estimated Value: $127,000 - $146,000
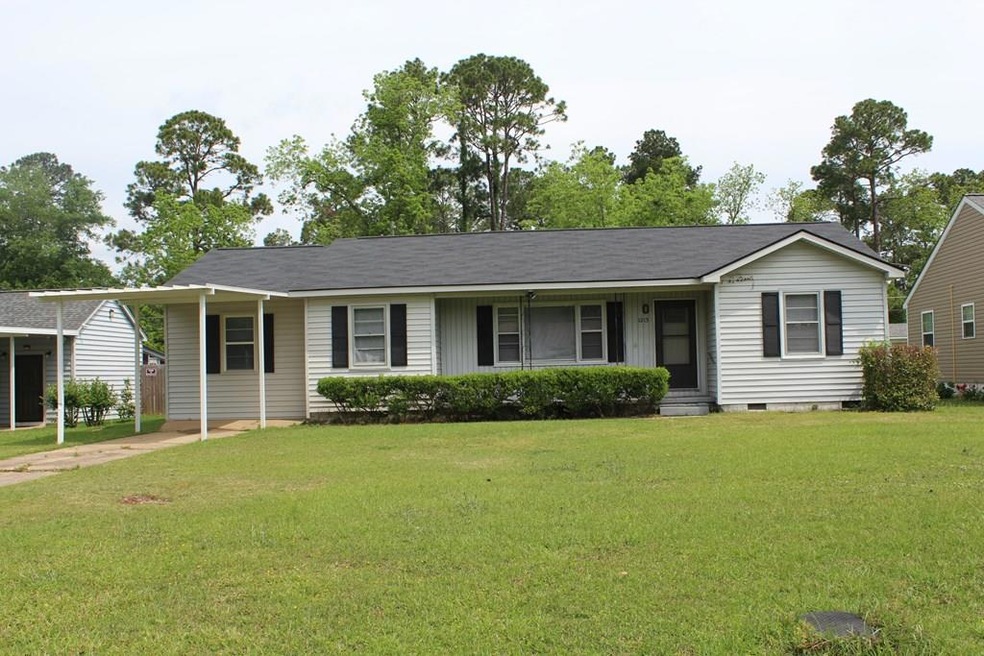
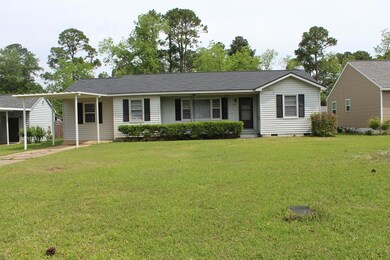
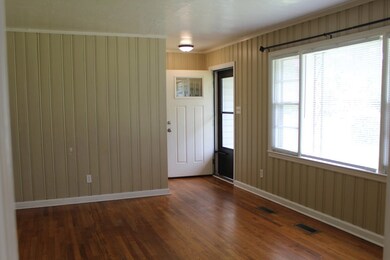
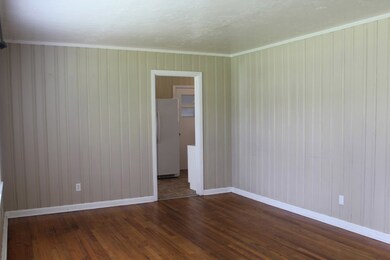
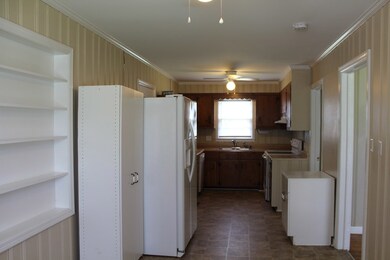
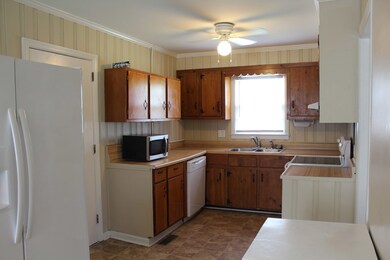
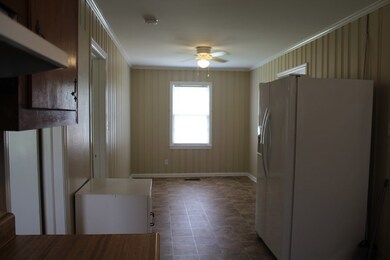
Immaculate 3bedroom/1 bath plus bonus room that could be a 4th bedroom! Beautiful hardwood floors thru out. Dine in kitchen includes stove and refrigerator. Fenced back yard!
Last Agent to Sell the Property
Hometown Realty Of Sw Ga Brokerage Phone: 2293472900 License #274198 Listed on: 07/18/2021
| Date | Buyer | Sale Price | Title Company |
|---|---|---|---|
| Mitchell Bobbi L | $94,000 | -- | |
| Rogers Susan Surface | -- | -- | |
| Marshall Frances Diana | -- | -- | |
| Surface Frank | -- | -- | |
| Rogers Susan Surface | -- | -- | |
| Mann Dorothy E | $55,000 | -- | |
| Cowell Margaret M | -- | -- |
| Date | Status | Borrower | Loan Amount |
|---|---|---|---|
| Open | Mitchell Bobbi L | $92,297 |
| Date | Event | Price | List to Sale | Price per Sq Ft |
|---|---|---|---|---|
| 07/12/2022 07/12/22 | Sold | $94,000 | -- | $63 / Sq Ft |
| 07/18/2021 07/18/21 | Pending | -- | -- | -- |
| Year | Tax Paid | Tax Assessment Tax Assessment Total Assessment is a certain percentage of the fair market value that is determined by local assessors to be the total taxable value of land and additions on the property. | Land | Improvement |
|---|---|---|---|---|
| 2024 | $1,422 | $29,800 | $5,680 | $24,120 |
| 2023 | $1,388 | $29,800 | $5,680 | $24,120 |
| 2022 | $1,221 | $26,120 | $5,680 | $20,440 |
| 2021 | $1,132 | $26,120 | $5,680 | $20,440 |
| 2020 | $1,135 | $26,120 | $5,680 | $20,440 |
| 2019 | $1,139 | $26,120 | $5,680 | $20,440 |
| 2018 | $1,144 | $26,120 | $5,680 | $20,440 |
| 2017 | $1,066 | $26,120 | $5,680 | $20,440 |
| 2016 | $1,066 | $26,120 | $5,680 | $20,440 |
| 2015 | $1,069 | $26,120 | $5,680 | $20,440 |
| 2014 | $838 | $27,520 | $7,080 | $20,440 |
S
Seller's Agent in 2022
Sandy Anthony
Hometown Realty Of Sw Ga
(229) 347-2900
1 in this area
226 Total Sales

Buyer's Agent in 2022
Jackie Dixon
1 Key Realty LLC
(229) 344-5966
4 in this area
142 Total Sales
Source: Albany Board of REALTORS®
MLS Number: 147477
APN: 0000G-00014-002