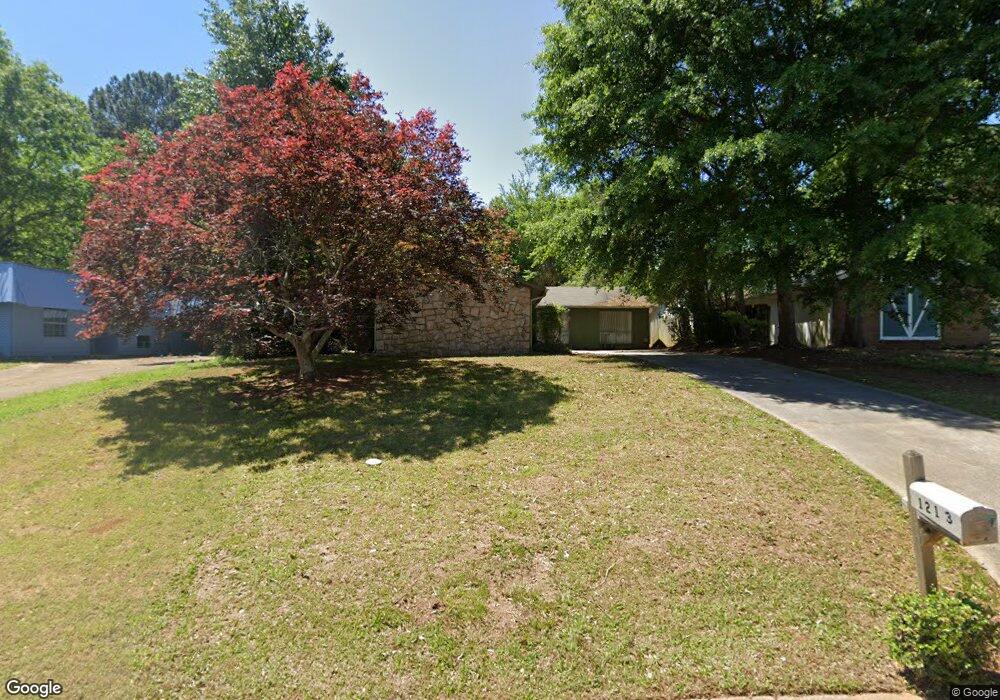
1213 Allgood Rd Stone Mountain, GA 30083
Estimated Value: $215,798 - $241,000
3
Beds
2
Baths
1,548
Sq Ft
$144/Sq Ft
Est. Value
About This Home
This home is located at 1213 Allgood Rd, Stone Mountain, GA 30083 and is currently estimated at $223,450, approximately $144 per square foot. 1213 Allgood Rd is a home located in DeKalb County with nearby schools including Allgood Elementary School, Freedom Middle School, and Clarkston High School.
Ownership History
Date
Name
Owned For
Owner Type
Purchase Details
Closed on
Oct 17, 2016
Sold by
Tookes Development Llc
Bought by
New Irection Ira Inc
Current Estimated Value
Purchase Details
Closed on
Nov 14, 2008
Sold by
Federal Home Loan Mortgage Corporation
Bought by
Curry Josiah
Purchase Details
Closed on
Sep 2, 2008
Sold by
Wells Fargo Bk Na
Bought by
Federal Home Loan Mortgage Corporation
Purchase Details
Closed on
Jul 17, 2008
Sold by
1213 Allgood Avenue Land Trust
Bought by
Thomas Gary
Purchase Details
Closed on
Jun 14, 2002
Sold by
Gary D Thomas & Stella Inv Inc
Bought by
Thomas Gary D
Home Financials for this Owner
Home Financials are based on the most recent Mortgage that was taken out on this home.
Original Mortgage
$105,600
Interest Rate
6.86%
Mortgage Type
New Conventional
Purchase Details
Closed on
Mar 12, 1997
Sold by
Rose Robert L
Bought by
Brinson Alvin
Create a Home Valuation Report for This Property
The Home Valuation Report is an in-depth analysis detailing your home's value as well as a comparison with similar homes in the area
Home Values in the Area
Average Home Value in this Area
Purchase History
| Date | Buyer | Sale Price | Title Company |
|---|---|---|---|
| New Irection Ira Inc | $50,000 | -- | |
| Tookes Development Llc | $30,000 | -- | |
| Curry Josiah | -- | -- | |
| Federal Home Loan Mortgage Corporation | -- | -- | |
| Wells Fargo Bk Na | $105,295 | -- | |
| Thomas Gary | -- | -- | |
| Thomas Gary D | -- | -- | |
| Brinson Alvin | $14,600 | -- |
Source: Public Records
Mortgage History
| Date | Status | Borrower | Loan Amount |
|---|---|---|---|
| Previous Owner | Thomas Gary D | $105,600 | |
| Closed | Brinson Alvin | $0 |
Source: Public Records
Tax History Compared to Growth
Tax History
| Year | Tax Paid | Tax Assessment Tax Assessment Total Assessment is a certain percentage of the fair market value that is determined by local assessors to be the total taxable value of land and additions on the property. | Land | Improvement |
|---|---|---|---|---|
| 2025 | $4,165 | $85,560 | $12,000 | $73,560 |
| 2024 | $4,317 | $89,120 | $11,200 | $77,920 |
| 2023 | $4,317 | $94,200 | $12,000 | $82,200 |
| 2022 | $3,262 | $67,200 | $6,000 | $61,200 |
| 2021 | $2,641 | $53,040 | $6,000 | $47,040 |
| 2020 | $2,330 | $45,960 | $6,000 | $39,960 |
| 2019 | $1,898 | $36,120 | $6,000 | $30,120 |
| 2018 | $1,363 | $23,840 | $3,880 | $19,960 |
| 2017 | $1,195 | $20,000 | $1,880 | $18,120 |
| 2016 | $1,306 | $22,480 | $3,880 | $18,600 |
| 2014 | $1,016 | $15,520 | $3,880 | $11,640 |
Source: Public Records
Map
Nearby Homes
- 4408 Redan Rd
- 1074 Cherokee Heights
- 4447 Lake Breeze Dr
- 1140 Allgood Rd
- 4467 Thornwood Crescent
- 1024 Oakwood Chase Cir
- 1104 To Lani Farm Rd
- 1215 Sharonton Dr
- 1214 Mannbrook Dr
- 1091 To Lani Dr
- 1115 Old Coach Rd
- 1239 Sharonton Dr
- 1188 To Lani Path
- 1276 To Lani Farm Rd
- 1248 To Lani Ct
- 4157 Autumn Hill Dr
- 1010 Allgood Rd
- 4205 Autumn Hill Dr
- 1219 To Lani Dr
- 4255 Autumn Woods Ct Unit 2
- 1207 Allgood Rd
- 1219 Allgood Rd
- 1225 Allgood Rd
- 1096 Sharonton Way
- 1210 Allgood Rd
- 1086 Sharonton Way
- 1228 Allgood Rd Unit 1
- 4406 Carriage Trail
- 1235 Allgood Rd
- 4407 Carriage Trail
- 4412 Carriage Trail
- 1234 Allgood Rd
- 4440 Redan Rd
- 4422 Redan Rd
- 4471 Redan Rd
- 4466 Redan Rd
- 4413 Carriage Trail Unit 1
- 1241 Allgood Rd
- 4406 Bridle Bluff
- 1097 Sharonton Way