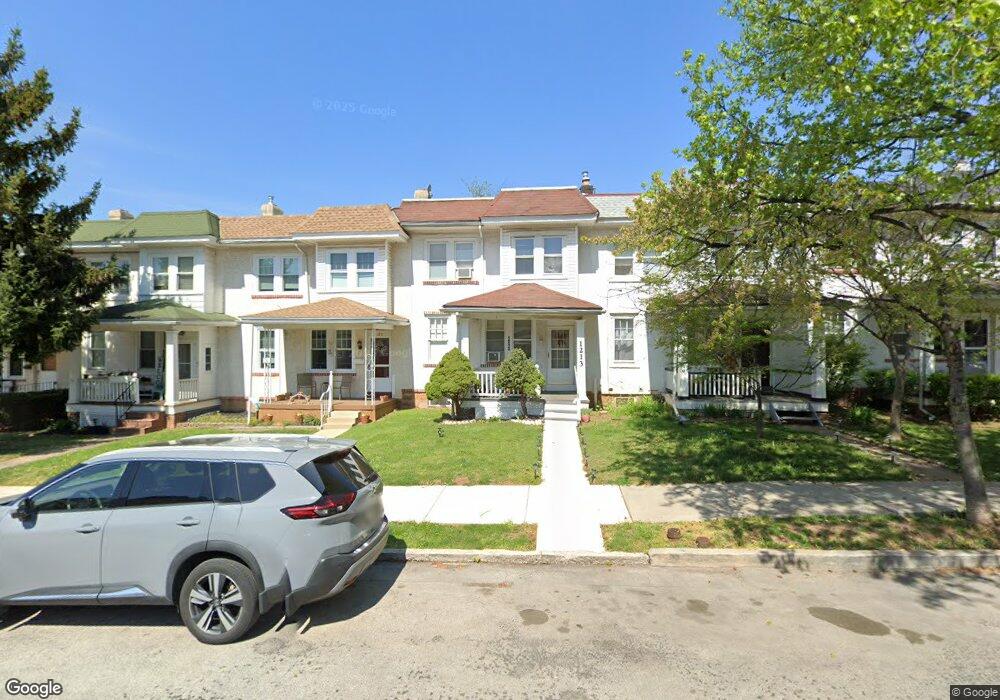
1213 Astor St Norristown, PA 19401
Estimated Value: $190,000 - $248,122
3
Beds
1
Bath
1,360
Sq Ft
$167/Sq Ft
Est. Value
About This Home
This home is located at 1213 Astor St, Norristown, PA 19401 and is currently estimated at $227,031, approximately $166 per square foot. 1213 Astor St is a home located in Montgomery County with nearby schools including Hancock Elementary School, Charles Blockson Middle School, and East Norriton Middle School.
Ownership History
Date
Name
Owned For
Owner Type
Purchase Details
Closed on
Sep 29, 2005
Sold by
Martin Joseph C and Martin Sandra L
Bought by
Jenik 4 Llc
Current Estimated Value
Purchase Details
Closed on
May 6, 1999
Sold by
Martin Joseph C
Bought by
Martin Joseph C and Martin Sandra L
Purchase Details
Closed on
Feb 23, 1999
Sold by
Federal National Mortgage Association
Bought by
Martin Joseph C
Purchase Details
Closed on
Nov 30, 1998
Sold by
Fennell Mark T and Fennell Sharon M
Bought by
Federal National Mortgage Association
Create a Home Valuation Report for This Property
The Home Valuation Report is an in-depth analysis detailing your home's value as well as a comparison with similar homes in the area
Home Values in the Area
Average Home Value in this Area
Purchase History
| Date | Buyer | Sale Price | Title Company |
|---|---|---|---|
| Jenik 4 Llc | $36,175 | None Available | |
| Martin Joseph C | -- | -- | |
| Martin Joseph C | $28,000 | Lawyers Title Insurance Corp | |
| Federal National Mortgage Association | $1,630 | -- |
Source: Public Records
Tax History Compared to Growth
Tax History
| Year | Tax Paid | Tax Assessment Tax Assessment Total Assessment is a certain percentage of the fair market value that is determined by local assessors to be the total taxable value of land and additions on the property. | Land | Improvement |
|---|---|---|---|---|
| 2025 | $4,910 | $80,000 | $21,950 | $58,050 |
| 2024 | $4,910 | $80,000 | $21,950 | $58,050 |
| 2023 | $4,866 | $80,000 | $21,950 | $58,050 |
| 2022 | $4,761 | $80,000 | $21,950 | $58,050 |
| 2021 | $4,738 | $80,000 | $21,950 | $58,050 |
| 2020 | $4,520 | $80,000 | $21,950 | $58,050 |
| 2019 | $4,437 | $80,000 | $21,950 | $58,050 |
| 2018 | $2,954 | $80,000 | $21,950 | $58,050 |
| 2017 | $4,075 | $80,000 | $21,950 | $58,050 |
| 2016 | $4,044 | $80,000 | $21,950 | $58,050 |
| 2015 | $3,874 | $80,000 | $21,950 | $58,050 |
| 2014 | $3,874 | $80,000 | $21,950 | $58,050 |
Source: Public Records
Map
Nearby Homes