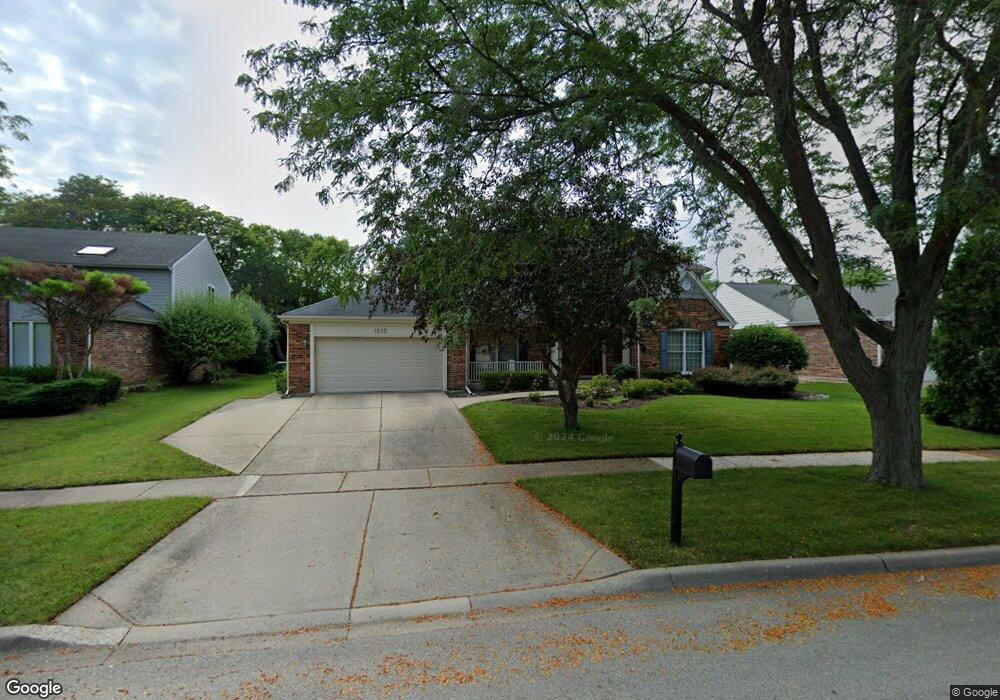
1213 Brian Cir Libertyville, IL 60048
North Mundelein NeighborhoodEstimated Value: $793,066 - $807,000
5
Beds
3
Baths
3,179
Sq Ft
$252/Sq Ft
Est. Value
About This Home
This home is located at 1213 Brian Cir, Libertyville, IL 60048 and is currently estimated at $801,267, approximately $252 per square foot. 1213 Brian Cir is a home located in Lake County with nearby schools including Butterfield School, Highland Middle School, and Libertyville High School.
Ownership History
Date
Name
Owned For
Owner Type
Purchase Details
Closed on
Nov 5, 2018
Sold by
Hartung Mark H and Hartung Laura W
Bought by
Hartung Mark and Hartung Laura
Current Estimated Value
Purchase Details
Closed on
Jul 29, 2005
Sold by
Giesler Marsha L and Giesler Richard C
Bought by
Hartung Mark H and Hartung Laura W
Home Financials for this Owner
Home Financials are based on the most recent Mortgage that was taken out on this home.
Original Mortgage
$491,200
Outstanding Balance
$255,375
Interest Rate
5.5%
Mortgage Type
Purchase Money Mortgage
Estimated Equity
$545,892
Purchase Details
Closed on
Oct 23, 2002
Sold by
Janaes Marsha L
Bought by
Giesler Richard C and Giesler Marsha L
Home Financials for this Owner
Home Financials are based on the most recent Mortgage that was taken out on this home.
Original Mortgage
$242,000
Interest Rate
5%
Purchase Details
Closed on
Aug 18, 1994
Sold by
Janaes Mark J
Bought by
Janaes Marsha L
Create a Home Valuation Report for This Property
The Home Valuation Report is an in-depth analysis detailing your home's value as well as a comparison with similar homes in the area
Home Values in the Area
Average Home Value in this Area
Purchase History
| Date | Buyer | Sale Price | Title Company |
|---|---|---|---|
| Hartung Mark | -- | None Available | |
| Hartung Mark H | $614,000 | Multiple | |
| Giesler Richard C | -- | First American Title | |
| Janaes Marsha L | -- | -- |
Source: Public Records
Mortgage History
| Date | Status | Borrower | Loan Amount |
|---|---|---|---|
| Open | Hartung Mark H | $491,200 | |
| Previous Owner | Giesler Richard C | $242,000 |
Source: Public Records
Tax History Compared to Growth
Tax History
| Year | Tax Paid | Tax Assessment Tax Assessment Total Assessment is a certain percentage of the fair market value that is determined by local assessors to be the total taxable value of land and additions on the property. | Land | Improvement |
|---|---|---|---|---|
| 2024 | $14,567 | $204,788 | $58,902 | $145,886 |
| 2023 | $13,124 | $188,884 | $54,328 | $134,556 |
| 2022 | $13,124 | $170,099 | $52,217 | $117,882 |
| 2021 | $14,092 | $184,930 | $56,770 | $128,160 |
| 2020 | $13,563 | $181,821 | $55,816 | $126,005 |
| 2019 | $13,226 | $180,092 | $55,285 | $124,807 |
| 2018 | $13,287 | $186,876 | $55,356 | $131,520 |
| 2017 | $13,103 | $180,976 | $53,608 | $127,368 |
| 2016 | $12,672 | $171,590 | $50,828 | $120,762 |
| 2015 | $12,352 | $160,379 | $47,507 | $112,872 |
| 2014 | $11,931 | $154,679 | $45,505 | $109,174 |
| 2012 | $12,295 | $156,021 | $45,900 | $110,121 |
Source: Public Records
Map
Nearby Homes
- 1708 Park Crest Ct
- 1338 Trinity Place
- 1917 Halifax St
- 1801 Torrey Pkwy
- 832 Interlaken Ln
- 1506 Bull Creek Dr
- 1960 Pinehurst Ct
- 1834 Torrey Pkwy Unit 103
- 531 Salceda Ln
- 591 Salceda Ln
- 1291 Banbury Rd
- 200 Ambria Dr
- 1304 Dunleer Dr
- 223 Kenloch Ave
- 1216 Kensington Dr
- 1330 W Park Ave
- 20924 & 20902 W Park Ave
- 178 Brookhill Rd
- 694 Parkside Ct
- 137 Racine Place
- 1209 Brian Cir
- 1217 Brian Cir
- 1212 Virginia Ave
- 1216 Virginia Ave
- 1208 Virginia Ave
- 1205 Brian Cir
- 1216 Brian Cir
- 1204 Virginia Ave
- 1212 Brian Cir
- 1220 Brian Cir
- 1740 Eric Ln
- 1736 Eric Ln
- 1200 Virginia Ave
- 1208 Brian Cir
- 1201 Brian Cir
- 1744 Eric Ln
- 1732 Eric Ln
- 1205 Lisa Cir
- 1213 Virginia Ave
- 1209 Virginia Ave