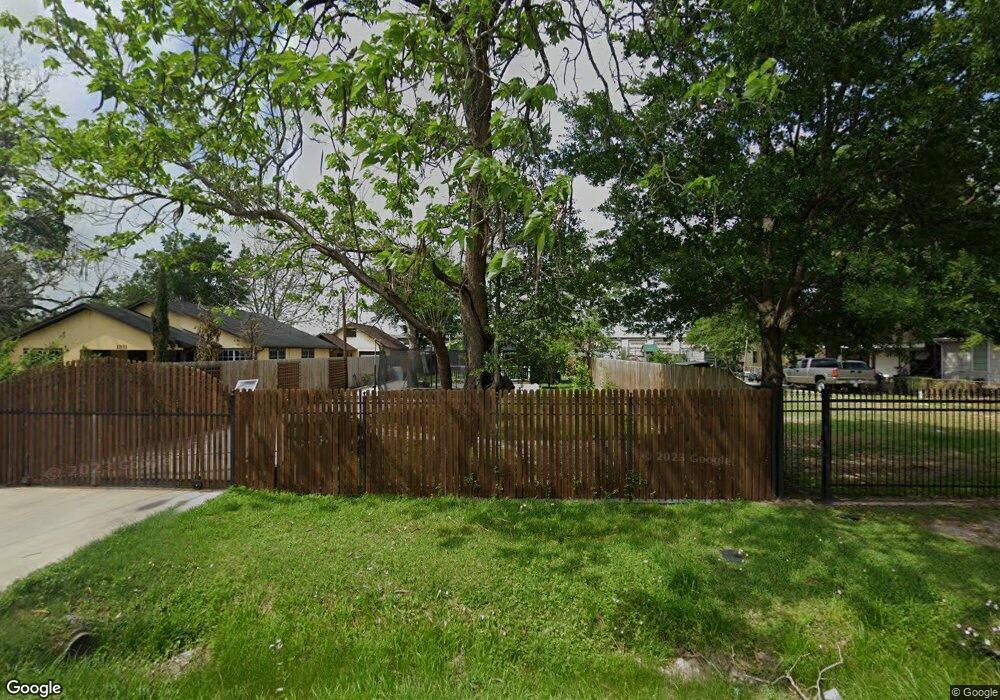
1213 De Boll St Houston, TX 77022
Northside-Northline NeighborhoodEstimated Value: $142,391 - $226,000
1
Bed
1
Bath
462
Sq Ft
$415/Sq Ft
Est. Value
About This Home
This home is located at 1213 De Boll St, Houston, TX 77022 and is currently estimated at $191,848, approximately $415 per square foot. 1213 De Boll St is a home located in Harris County with nearby schools including Burbank Elementary School, Burbank Middle School, and Sam Houston Math, Science & Technology Center.
Ownership History
Date
Name
Owned For
Owner Type
Purchase Details
Closed on
May 25, 2011
Sold by
Wirth Peter
Bought by
Guiterrez Guadalupe and Hughes Daniela
Current Estimated Value
Purchase Details
Closed on
Dec 17, 2010
Sold by
Gutierrez Painting Inc
Bought by
Gutierrez Cabrera Guadalupe
Home Financials for this Owner
Home Financials are based on the most recent Mortgage that was taken out on this home.
Original Mortgage
$40,000
Interest Rate
4.24%
Mortgage Type
Seller Take Back
Purchase Details
Closed on
Sep 1, 2004
Sold by
Windsor Linda Beth Wiggins
Bought by
Gutierrez Painting Inc
Home Financials for this Owner
Home Financials are based on the most recent Mortgage that was taken out on this home.
Original Mortgage
$13,000
Interest Rate
5.86%
Mortgage Type
Seller Take Back
Create a Home Valuation Report for This Property
The Home Valuation Report is an in-depth analysis detailing your home's value as well as a comparison with similar homes in the area
Home Values in the Area
Average Home Value in this Area
Purchase History
| Date | Buyer | Sale Price | Title Company |
|---|---|---|---|
| Guiterrez Guadalupe | -- | Stewart Title | |
| Gutierrez Cabrera Guadalupe | -- | None Available | |
| Gutierrez Painting Inc | -- | -- |
Source: Public Records
Mortgage History
| Date | Status | Borrower | Loan Amount |
|---|---|---|---|
| Previous Owner | Gutierrez Cabrera Guadalupe | $40,000 | |
| Previous Owner | Gutierrez Painting Inc | $13,000 |
Source: Public Records
Tax History Compared to Growth
Tax History
| Year | Tax Paid | Tax Assessment Tax Assessment Total Assessment is a certain percentage of the fair market value that is determined by local assessors to be the total taxable value of land and additions on the property. | Land | Improvement |
|---|---|---|---|---|
| 2025 | $836 | $154,711 | $102,600 | $52,111 |
| 2024 | $836 | $143,688 | $94,163 | $49,525 |
| 2023 | $836 | $124,691 | $57,375 | $67,316 |
| 2022 | $1,549 | $111,384 | $57,375 | $54,009 |
| 2021 | $1,490 | $98,087 | $57,375 | $40,712 |
| 2020 | $1,408 | $93,331 | $57,375 | $35,956 |
| 2019 | $1,337 | $85,098 | $47,250 | $37,848 |
| 2018 | $675 | $70,964 | $39,488 | $31,476 |
| 2017 | $1,104 | $70,964 | $39,488 | $31,476 |
| 2016 | $1,004 | $61,367 | $37,125 | $24,242 |
| 2015 | $565 | $36,095 | $27,000 | $9,095 |
| 2014 | $565 | $36,095 | $27,000 | $9,095 |
Source: Public Records
Map
Nearby Homes
- 1207 Firnat St
- 807 Firnat St
- 723 Doverside St
- 702 Pennington St
- 9026 Mcgallion Rd
- 1104 Charnwood St
- 8411 Berry Brush Ln
- 8402 Berry Green Ln
- 802 Berry Sage Ln
- 88 Berry Rd
- 9650 E Hardy Rd
- 8109 W Hardy Rd
- 318 Charlock St
- 743 Apache St
- 411 Berry Rd
- 631 Apache St
- 1016 Apache St
- 714 Apache St
- 8205 Appleton St
- 8718 Brannon St
- 1215 De Boll St
- 1211 De Boll St
- 1219 De Boll St
- 1203 De Boll St
- 1223 De Boll St
- 1303 De Boll St
- 1201 De Boll St
- 1216 De Boll St
- 1212 De Boll St
- 1305 De Boll St
- 1206 De Boll St
- 1204 De Boll St
- 1202 De Boll St
- 1311 De Boll St
- 1306 De Boll St
- 9108 Irvington Blvd
- 1211 Firnat St
- 1312 De Boll St
- 9104 Irvington Blvd
- 1316 De Boll St