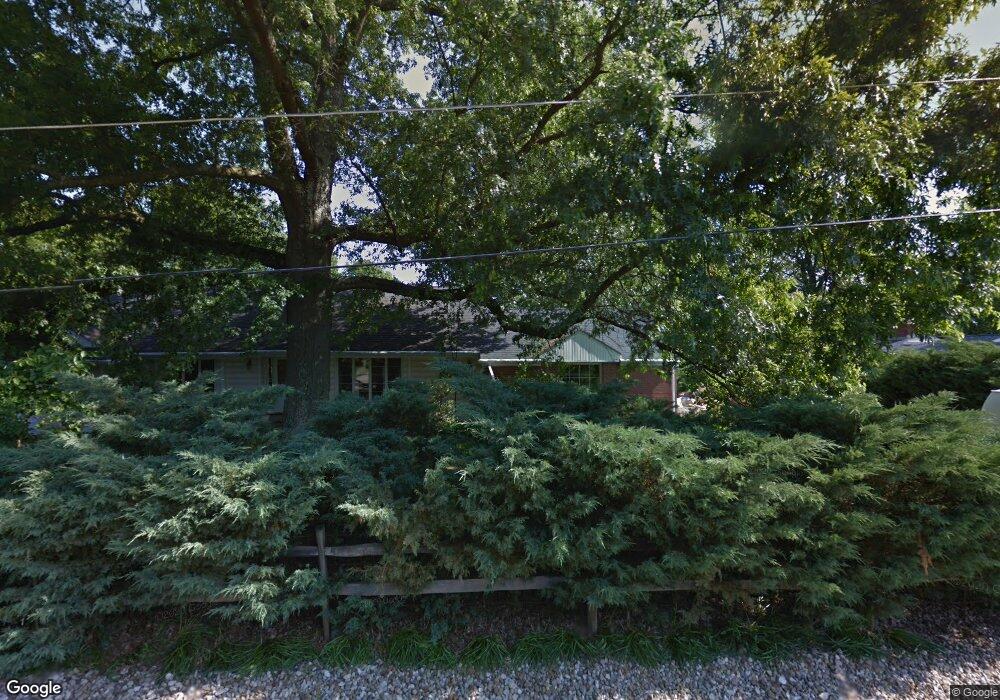
1213 E Chestnut St Mount Vernon, OH 43050
Estimated Value: $281,000 - $328,000
2
Beds
3
Baths
1,812
Sq Ft
$166/Sq Ft
Est. Value
About This Home
This home is located at 1213 E Chestnut St, Mount Vernon, OH 43050 and is currently estimated at $300,154, approximately $165 per square foot. 1213 E Chestnut St is a home located in Knox County with nearby schools including Mount Vernon High School, St. Vincent de Paul School, and Mount Vernon Sda Elementary School.
Ownership History
Date
Name
Owned For
Owner Type
Purchase Details
Closed on
May 4, 2016
Sold by
Tiede Roy N and Tiede Anita D
Bought by
Tiede Roy N and Tiede Anita P
Current Estimated Value
Purchase Details
Closed on
Mar 23, 1999
Sold by
Vance William D and Vance Margare
Bought by
Tiede Roy N and Tiede Anita A
Purchase Details
Closed on
Nov 22, 1996
Bought by
Vance William D and Vance Margare
Purchase Details
Closed on
Mar 23, 1995
Bought by
Simmons Rita R Revocable
Purchase Details
Closed on
Jun 28, 1994
Sold by
Simmons Dale W and Simmons Rita R
Bought by
Simmons Rita R Trustee
Create a Home Valuation Report for This Property
The Home Valuation Report is an in-depth analysis detailing your home's value as well as a comparison with similar homes in the area
Home Values in the Area
Average Home Value in this Area
Purchase History
| Date | Buyer | Sale Price | Title Company |
|---|---|---|---|
| Tiede Roy N | -- | None Available | |
| Tiede Roy N | $162,000 | -- | |
| Vance William D | $140,000 | -- | |
| Simmons Rita R Revocable | -- | -- | |
| Simmons Rita R Trustee | -- | -- |
Source: Public Records
Tax History Compared to Growth
Tax History
| Year | Tax Paid | Tax Assessment Tax Assessment Total Assessment is a certain percentage of the fair market value that is determined by local assessors to be the total taxable value of land and additions on the property. | Land | Improvement |
|---|---|---|---|---|
| 2024 | $2,863 | $84,050 | $9,190 | $74,860 |
| 2023 | $2,863 | $84,050 | $9,190 | $74,860 |
| 2022 | $2,327 | $63,670 | $6,960 | $56,710 |
| 2021 | $2,327 | $63,670 | $6,960 | $56,710 |
| 2020 | $2,627 | $63,670 | $6,960 | $56,710 |
| 2019 | $2,203 | $49,760 | $7,520 | $42,240 |
| 2018 | $2,203 | $49,760 | $7,520 | $42,240 |
| 2017 | $2,135 | $49,100 | $7,520 | $41,580 |
| 2016 | $1,981 | $45,460 | $6,960 | $38,500 |
| 2015 | $1,989 | $45,460 | $6,960 | $38,500 |
| 2014 | $1,999 | $45,460 | $6,960 | $38,500 |
| 2013 | $2,370 | $51,370 | $6,550 | $44,820 |
Source: Public Records
Map
Nearby Homes
- 301 Teryl Dr
- 17900 New Gambier Rd
- 802 Coshocton Ave
- 1109 Oak Street Extension
- 200 Eastwood Dr
- 1107 Oak Street Extension
- 11 Highland Dr
- 2 Coventry Ct
- 4 Craig Dr
- 14 Hilltop Dr
- 49 Woodlake Trail
- 501 Oak St
- 203 S Center St
- 900 E Gambier St
- 55 Wildwood Ln
- 812 Howard St
- 23 Upland Terrace
- 6 Fairway Dr
- 1575 New Gambier Rd
- 0 Wildwood Ln