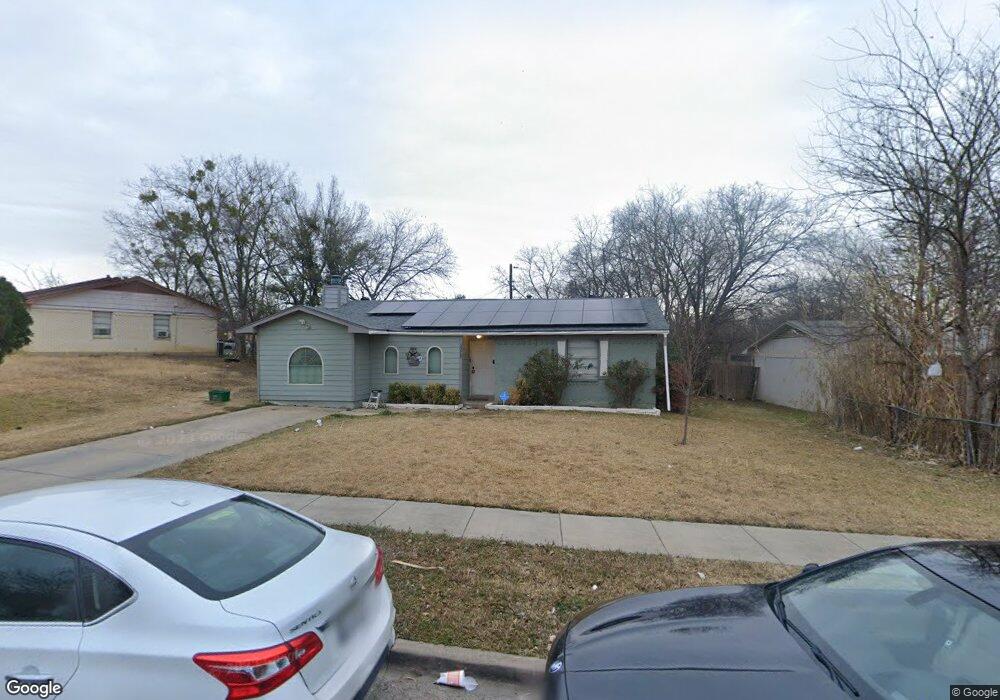
1213 Edgemont Dr Mesquite, TX 75149
Estimated Value: $200,000 - $223,000
3
Beds
1
Bath
947
Sq Ft
$224/Sq Ft
Est. Value
About This Home
This home is located at 1213 Edgemont Dr, Mesquite, TX 75149 and is currently estimated at $212,491, approximately $224 per square foot. 1213 Edgemont Dr is a home located in Dallas County with nearby schools including Mcwhorter Elementary School, Lanny Frasier Middle, and West Mesquite High School.
Ownership History
Date
Name
Owned For
Owner Type
Purchase Details
Closed on
Feb 13, 2026
Sold by
Ayala Martha Patricia
Bought by
Carrazco Armando
Current Estimated Value
Home Financials for this Owner
Home Financials are based on the most recent Mortgage that was taken out on this home.
Original Mortgage
$141,000
Outstanding Balance
$141,000
Interest Rate
6.16%
Mortgage Type
Credit Line Revolving
Estimated Equity
$71,491
Purchase Details
Closed on
Feb 20, 2015
Sold by
Chapman Christopher G and Chapman James K
Bought by
Corrazco Armando
Home Financials for this Owner
Home Financials are based on the most recent Mortgage that was taken out on this home.
Original Mortgage
$66,768
Interest Rate
4.25%
Mortgage Type
FHA
Purchase Details
Closed on
Mar 12, 2004
Sold by
First State Bank Mesquite
Bought by
Chapman Cheryl D
Purchase Details
Closed on
Jun 4, 2003
Sold by
Coon Arnold L and Pavlica Kerri
Bought by
Chapman Christopher G and Chapman Cheryl D
Home Financials for this Owner
Home Financials are based on the most recent Mortgage that was taken out on this home.
Original Mortgage
$49,460
Interest Rate
5.65%
Mortgage Type
Purchase Money Mortgage
Create a Home Valuation Report for This Property
The Home Valuation Report is an in-depth analysis detailing your home's value as well as a comparison with similar homes in the area
Purchase History
| Date | Buyer | Sale Price | Title Company |
|---|---|---|---|
| Carrazco Armando | -- | None Listed On Document | |
| Corrazco Armando | -- | None Available | |
| Chapman Cheryl D | -- | Nat | |
| First State Bank Mesquite | -- | -- | |
| Chapman Christopher G | -- | -- |
Source: Public Records
Mortgage History
| Date | Status | Borrower | Loan Amount |
|---|---|---|---|
| Open | Carrazco Armando | $141,000 | |
| Previous Owner | Corrazco Armando | $66,768 | |
| Previous Owner | Chapman Christopher G | $49,460 | |
| Closed | First State Bank Mesquite | $0 |
Source: Public Records
Tax History
| Year | Tax Paid | Tax Assessment Tax Assessment Total Assessment is a certain percentage of the fair market value that is determined by local assessors to be the total taxable value of land and additions on the property. | Land | Improvement |
|---|---|---|---|---|
| 2025 | $1,731 | $188,430 | $55,000 | $133,430 |
| 2024 | $1,731 | $188,430 | $55,000 | $133,430 |
| 2023 | $1,731 | $170,800 | $40,000 | $130,800 |
| 2022 | $4,291 | $170,800 | $40,000 | $130,800 |
| 2021 | $3,419 | $129,640 | $30,000 | $99,640 |
| 2020 | $3,095 | $110,740 | $30,000 | $80,740 |
| 2019 | $3,223 | $110,740 | $30,000 | $80,740 |
| 2018 | $2,593 | $92,480 | $26,000 | $66,480 |
| 2017 | $2,097 | $74,850 | $15,000 | $59,850 |
| 2016 | $1,670 | $59,600 | $15,000 | $44,600 |
| 2015 | $1,419 | $52,300 | $15,000 | $37,300 |
| 2014 | $1,419 | $52,300 | $15,000 | $37,300 |
Source: Public Records
Map
Nearby Homes
- 1221 Rusk Dr
- 1914 Del Oak Dr
- Lot 15 Central Park Ct
- Lot 14 Central Park Ct
- 1410 Athens Dr
- 1837 Grove Cir
- 1325 Woodcrest Dr
- 1309 Woodcrest Dr
- 1901 Pyramid Dr
- 1530 Carson Dr
- 2441 Lindale Ln
- 2425 Avis St
- 2429 Avis St
- 11915 Carson Dr
- 1418 Briarwood Dr
- 11805 Eloise Dr
- 1409 W Bruton Rd
- 1757 Patrick Cir
- 1300 Develon Dr
- 1726 Hillcrest Ct
- 1221 Edgemont Dr
- 2024 Del Oak Dr
- 1205 Edgemont Dr
- 2020 Del Oak Dr
- 1212 Edgemont Dr
- 1216 Edgemont Dr
- 1208 Edgemont Dr
- 2045 Avis Cir
- 1201 Edgemont Dr
- 2016 Del Oak Dr
- 1220 Edgemont Dr
- 1204 Edgemont Dr
- 1224 Edgemont Dr
- 2041 Avis Cir
- 2029 Del Oak Dr
- 2101 Avis St
- 2012 Del Oak Dr
- 2025 Del Oak Dr
- 1300 Edgemont Dr
- 2021 Del Oak Dr
Your Personal Tour Guide
Ask me questions while you tour the home.