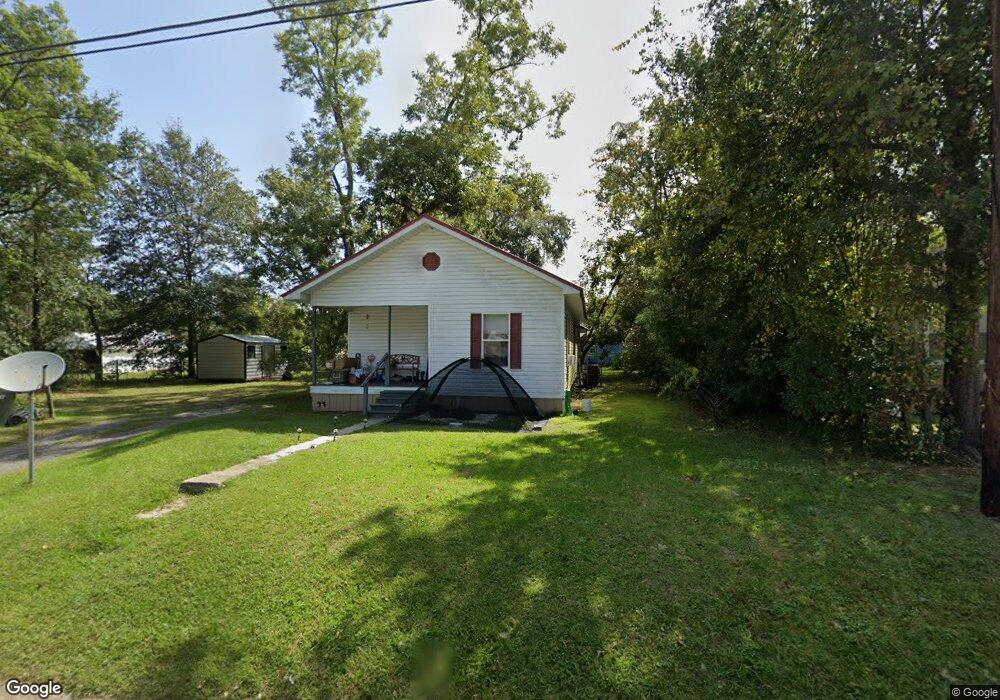
1213 Georgia St Waycross, GA 31503
Estimated Value: $92,000 - $111,000
2
Beds
1
Bath
1,040
Sq Ft
$95/Sq Ft
Est. Value
About This Home
This home is located at 1213 Georgia St, Waycross, GA 31503 and is currently estimated at $98,880, approximately $95 per square foot. 1213 Georgia St is a home located in Ware County with nearby schools including Ruskin Elementary School, Ware County Middle School, and Ware County High School.
Ownership History
Date
Name
Owned For
Owner Type
Purchase Details
Closed on
Aug 8, 2022
Sold by
R J Welch & Son Inc
Bought by
L J Welch & Associates Inc
Current Estimated Value
Purchase Details
Closed on
Sep 5, 2014
Sold by
Welch R J
Bought by
R J Welch & Son Inc
Purchase Details
Closed on
Aug 13, 2014
Sold by
Wilson David R
Bought by
Welch R J
Purchase Details
Closed on
Apr 9, 2010
Sold by
Norton James Philip
Bought by
Bricker David
Purchase Details
Closed on
Nov 21, 2008
Sold by
Beecher Syble
Bought by
Beecher Thomas Clyde
Purchase Details
Closed on
Mar 8, 2006
Sold by
Altman Rhonda White
Bought by
Little Vera
Purchase Details
Closed on
Feb 24, 2006
Sold by
Altman Rhonda Laverne Whit
Bought by
Altman Rhonda Laverne
Purchase Details
Closed on
Feb 25, 2003
Sold by
White Rhonda L
Bought by
White Betty Crews
Purchase Details
Closed on
Aug 19, 1997
Sold by
White Betty
Bought by
White Rhonda L
Create a Home Valuation Report for This Property
The Home Valuation Report is an in-depth analysis detailing your home's value as well as a comparison with similar homes in the area
Home Values in the Area
Average Home Value in this Area
Purchase History
| Date | Buyer | Sale Price | Title Company |
|---|---|---|---|
| L J Welch & Associates Inc | -- | -- | |
| R J Welch & Son Inc | $1,588 | -- | |
| Welch R J | -- | -- | |
| Bricker David | $12,000 | -- | |
| Beecher Thomas Clyde | -- | -- | |
| Little Vera | $9,000 | -- | |
| Altman Rhonda Laverne | -- | -- | |
| White Betty Crews | -- | -- | |
| White Rhonda L | -- | -- |
Source: Public Records
Tax History Compared to Growth
Tax History
| Year | Tax Paid | Tax Assessment Tax Assessment Total Assessment is a certain percentage of the fair market value that is determined by local assessors to be the total taxable value of land and additions on the property. | Land | Improvement |
|---|---|---|---|---|
| 2024 | $834 | $27,017 | $1,776 | $25,241 |
| 2023 | $932 | $14,096 | $1,242 | $12,854 |
| 2022 | $562 | $14,096 | $1,242 | $12,854 |
| 2021 | $426 | $9,844 | $1,242 | $8,602 |
| 2020 | $422 | $9,683 | $1,242 | $8,441 |
| 2019 | $410 | $9,281 | $1,242 | $8,039 |
| 2018 | $402 | $9,000 | $1,242 | $7,758 |
| 2017 | $392 | $9,000 | $1,242 | $7,758 |
| 2016 | $392 | $9,000 | $1,242 | $7,758 |
| 2015 | $255 | $5,806 | $1,242 | $4,564 |
| 2014 | $255 | $5,807 | $1,242 | $4,564 |
| 2013 | -- | $5,806 | $1,242 | $4,564 |
Source: Public Records
Map
Nearby Homes
- 1125 Georgia St
- 1208 Margaret St
- 1103 Ann St
- 0 S Georgia Pkwy W
- 1322 Jane St
- 0 Camp Branch Cross Rd Unit 12958956
- 0 Camp Branch Cross Rd Unit 147575
- 0 Camp Branch Cross Rd Unit 10127958
- 1401 Carswell Ave
- 6905 Kendal Ct
- 503 N Nicholls St
- 505 N Nicholls St
- 803 Elizabeth St
- 1003 Carswell Ave
- 605 Walker St
- 601 N Nicholls St
- 506 McDonald St
- 00 Roosevelt St
- 1006 Roosevelt St
- 516 Folks St
- 1215 Georgia St
- 1208 Jewel St
- 1210 Jewel St
- 1212 Georgia St
- 1214 Georgia St
- 1207 Georgia St
- 1210 Georgia St
- 1218 Georgia St
- 1301 Georgia St
- 1206 Georgia St
- 1302 Georgia St
- 1206 Jewel St
- 1205 Georgia St
- 301 Myers St
- 302 Myers St
- 1302 Jewel St
- 419 S Crawford St
- 1202 Georgia St
- 1209 Jewel St
- 1301 Jewel St