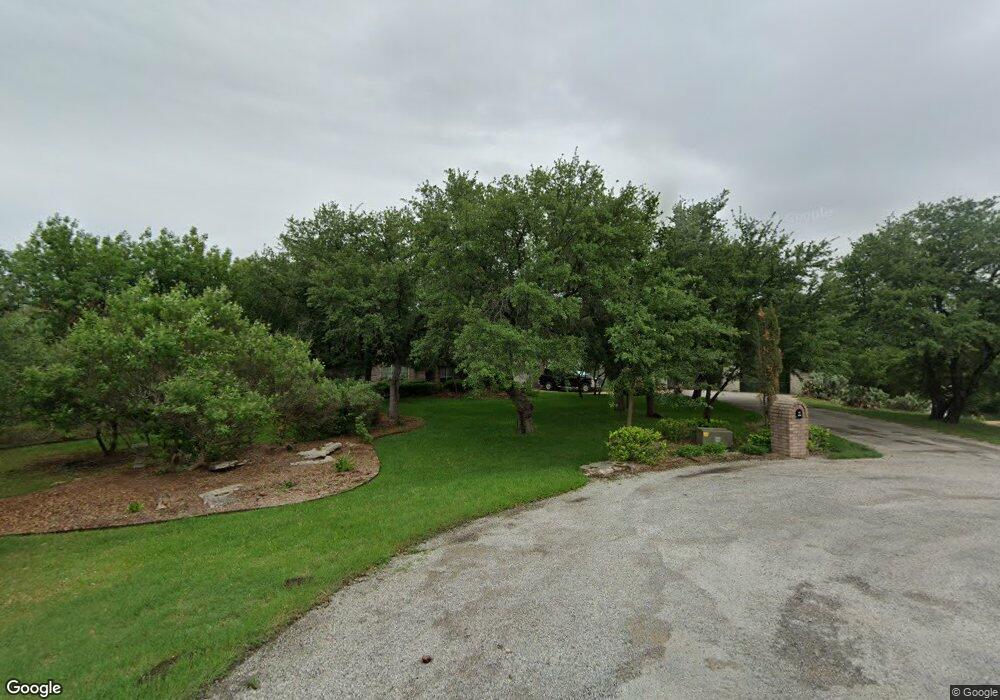
1213 Horizon Ct Granbury, TX 76049
Estimated Value: $876,000 - $1,316,000
4
Beds
4
Baths
3,155
Sq Ft
$340/Sq Ft
Est. Value
About This Home
This home is located at 1213 Horizon Ct, Granbury, TX 76049 and is currently estimated at $1,073,830, approximately $340 per square foot. 1213 Horizon Ct is a home located in Hood County with nearby schools including Brawner Elementary School, Granbury Middle School, and Granbury High School.
Ownership History
Date
Name
Owned For
Owner Type
Purchase Details
Closed on
Jan 6, 2025
Sold by
Ellis Quinten Lane and Ellis Ivy V
Bought by
Quinten L Ellis And Ivy V Ellis Revocable Tru and Ellis
Current Estimated Value
Purchase Details
Closed on
Jun 11, 2019
Sold by
Chenault Louis W and Chenault Judy D
Bought by
Ellis Quinten and Ellis Ivy
Home Financials for this Owner
Home Financials are based on the most recent Mortgage that was taken out on this home.
Original Mortgage
$484,350
Interest Rate
4.1%
Mortgage Type
New Conventional
Purchase Details
Closed on
May 16, 2008
Sold by
Kyger Tom M and Kyger Thomas Murray
Bought by
Chenault Louis W and Chenault Judy D
Home Financials for this Owner
Home Financials are based on the most recent Mortgage that was taken out on this home.
Original Mortgage
$417,000
Interest Rate
5.89%
Mortgage Type
Purchase Money Mortgage
Purchase Details
Closed on
Jan 6, 1998
Sold by
Granbury and Mak J
Bought by
Chenault Louis and Chenault Judy D
Purchase Details
Closed on
Jul 29, 1997
Bought by
Chenault Louis and Chenault Judy D
Create a Home Valuation Report for This Property
The Home Valuation Report is an in-depth analysis detailing your home's value as well as a comparison with similar homes in the area
Home Values in the Area
Average Home Value in this Area
Purchase History
| Date | Buyer | Sale Price | Title Company |
|---|---|---|---|
| Quinten L Ellis And Ivy V Ellis Revocable Tru | -- | None Listed On Document | |
| Ellis Quinten | -- | Town Square Title Company | |
| Chenault Louis W | -- | None Available | |
| Chenault Louis | -- | -- | |
| Chenault Louis | -- | -- |
Source: Public Records
Mortgage History
| Date | Status | Borrower | Loan Amount |
|---|---|---|---|
| Previous Owner | Ellis Quinten | $484,350 | |
| Previous Owner | Chenault Louis W | $417,000 |
Source: Public Records
Tax History Compared to Growth
Tax History
| Year | Tax Paid | Tax Assessment Tax Assessment Total Assessment is a certain percentage of the fair market value that is determined by local assessors to be the total taxable value of land and additions on the property. | Land | Improvement |
|---|---|---|---|---|
| 2025 | $13,063 | $0 | $0 | $0 |
| 2024 | $12,923 | $1,062,000 | $0 | $0 |
| 2023 | $13,078 | $1,074,730 | $310,000 | $764,730 |
| 2022 | $15,235 | $1,144,860 | $260,000 | $884,860 |
| 2021 | $9,485 | $617,850 | $200,000 | $417,850 |
| 2020 | $9,748 | $627,660 | $200,000 | $427,660 |
| 2019 | $10,038 | $617,470 | $200,000 | $417,470 |
| 2018 | $8,703 | $535,320 | $165,000 | $370,320 |
| 2017 | $9,024 | $539,650 | $165,000 | $374,650 |
| 2016 | $8,261 | $494,010 | $165,000 | $329,010 |
| 2015 | $8,817 | $532,210 | $148,500 | $383,710 |
| 2014 | $8,817 | $532,210 | $148,500 | $383,710 |
Source: Public Records
Map
Nearby Homes
- 2804 Alta Vista Ct
- 1206 E Baja Ct
- 1208 E Baja Ct
- 1302 E Baja Ct
- 821 Williamson Rd
- 1716 Bent Tree Ct
- 614 Pluto St
- 1204 E Scandinavian Ct
- 2208 Beau West Ct
- 2214 Tree Top Ct
- 2810 Sky Harbour Dr
- 2812 Sky Harbour Dr
- 710 Sun Ct
- 419 Sky Harbour Ct
- 2901 Space Ct
- 417 Sky Harbour Ct
- 616 W Aquarius Ct
- Lot 54 W Aquarius Ct
- 1407 Lady Amber Ln
- 805 E Aquarius Ct
- 1215 Horizon Ct
- 4920 Opal Ct
- 783 Rolling Terrace Cir
- 1209 Horizon Ct
- 1203 Horizon Ct
- 1201 Horizon Ct
- 2601 Alta Vista Ct
- 2507 Alta Vista Ct
- 2100 Tree Top Ct
- 504 Bella Ct
- 2503 Alta Vista Ct
- 2501 Alta Vista Ct
- 2701 Alta Vista Ct
- 2605 Alta Vista Ct
- 2500 Alta Vista Ct
- 2102 Tree Top Ct
- 2825 Alta Vista Ct
- 2504 Alta Vista Ct
- 2700 Alta Vista Ct
- 2016 Tree Top Ct