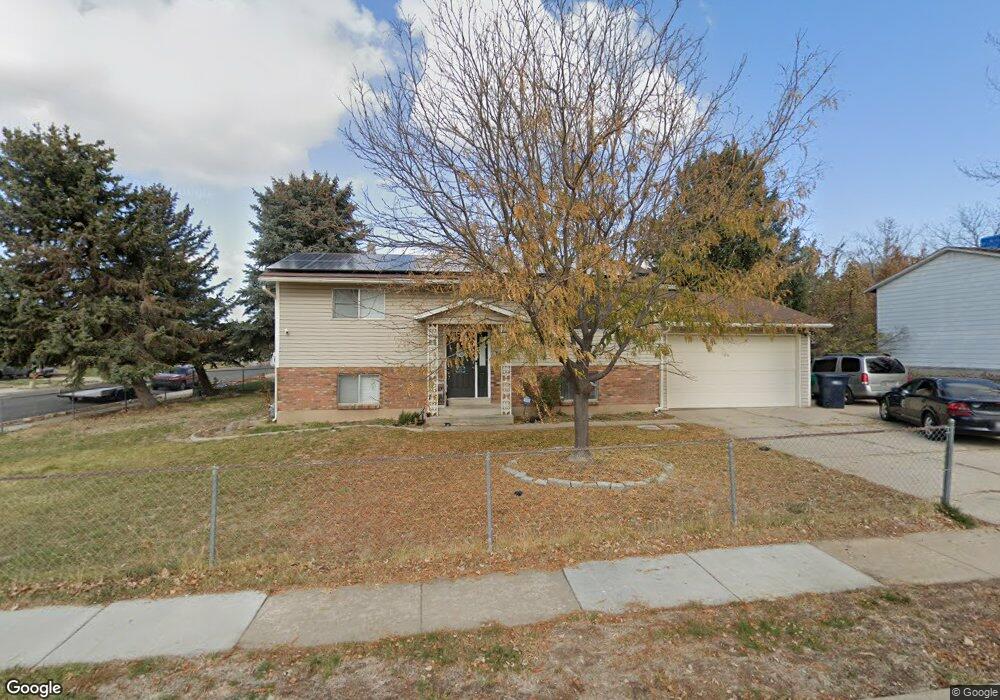
1213 Jeff St Layton, UT 84040
Estimated Value: $430,000 - $469,000
4
Beds
2
Baths
1,824
Sq Ft
$249/Sq Ft
Est. Value
About This Home
This home is located at 1213 Jeff St, Layton, UT 84040 and is currently estimated at $454,891, approximately $249 per square foot. 1213 Jeff St is a home located in Davis County with nearby schools including King Elementary School, Central Davis Junior High School, and Layton High School.
Ownership History
Date
Name
Owned For
Owner Type
Purchase Details
Closed on
Sep 17, 2021
Sold by
Turner Dustin and Turner Jennifer
Bought by
Duncan Ryan Chase and Duncan Laura
Current Estimated Value
Home Financials for this Owner
Home Financials are based on the most recent Mortgage that was taken out on this home.
Original Mortgage
$370,405
Outstanding Balance
$336,538
Interest Rate
2.7%
Mortgage Type
New Conventional
Estimated Equity
$118,353
Purchase Details
Closed on
Feb 12, 2015
Sold by
Woodbury Douglas A and Woodbury Lark R
Bought by
Green Kody and Hyatt Ashlee
Purchase Details
Closed on
Nov 13, 2006
Sold by
Adams Travis Joel
Bought by
Bryner Chad E and Bryner Kassi R
Home Financials for this Owner
Home Financials are based on the most recent Mortgage that was taken out on this home.
Original Mortgage
$173,655
Interest Rate
6.36%
Mortgage Type
VA
Purchase Details
Closed on
Jan 11, 2006
Sold by
Adams Kristin Riley
Bought by
Adams Travis Joel
Create a Home Valuation Report for This Property
The Home Valuation Report is an in-depth analysis detailing your home's value as well as a comparison with similar homes in the area
Home Values in the Area
Average Home Value in this Area
Purchase History
| Date | Buyer | Sale Price | Title Company |
|---|---|---|---|
| Duncan Ryan Chase | -- | Amicus Title & Escrow | |
| Green Kody | -- | Backman Title Servic | |
| Bryner Chad E | -- | Mountain View Title & Escrow | |
| Adams Travis Joel | -- | None Available |
Source: Public Records
Mortgage History
| Date | Status | Borrower | Loan Amount |
|---|---|---|---|
| Open | Duncan Ryan Chase | $370,405 | |
| Previous Owner | Bryner Chad E | $173,655 |
Source: Public Records
Tax History
| Year | Tax Paid | Tax Assessment Tax Assessment Total Assessment is a certain percentage of the fair market value that is determined by local assessors to be the total taxable value of land and additions on the property. | Land | Improvement |
|---|---|---|---|---|
| 2025 | $2,148 | $225,500 | $118,723 | $106,777 |
| 2024 | $2,060 | $217,800 | $143,521 | $74,279 |
| 2023 | $2,033 | $379,000 | $195,722 | $183,278 |
| 2022 | $2,125 | $215,050 | $104,789 | $110,261 |
| 2021 | $0 | $300,000 | $159,168 | $140,832 |
| 2020 | $1,719 | $249,000 | $127,649 | $121,351 |
| 2019 | $1,706 | $242,000 | $114,295 | $127,705 |
| 2018 | $1,559 | $222,000 | $88,025 | $133,975 |
| 2016 | $1,265 | $92,895 | $46,342 | $46,553 |
| 2015 | $1,214 | $84,645 | $46,342 | $38,303 |
| 2014 | $1,147 | $81,749 | $46,342 | $35,407 |
| 2013 | -- | $88,142 | $22,748 | $65,394 |
Source: Public Records
Map
Nearby Homes
- 1258 E North Lisa St
- 1048 E Cherry Ln
- 1340 E Hollyhock Way
- 1350 Kays Creek Dr
- 1354 E Hollyhock Way
- 1266 E Larkspur Way
- 1033 E 825 N
- 1305 E Larkspur Way
- 997 E 825 N
- 1545 E 975 N
- 1476 Kays Creek Dr
- 1465 E Sego Lily Ct
- 1540 E Primrose Ln
- 1503 E 530 N
- 861 E 575 N
- 1843 Hayes Dr
- 508 N Adamswood Rd
- 556 N Fairfield Rd Unit A2
- 556 N Fairfield Rd Unit D1
- 556 N Fairfield Rd Unit D2
Your Personal Tour Guide
Ask me questions while you tour the home.