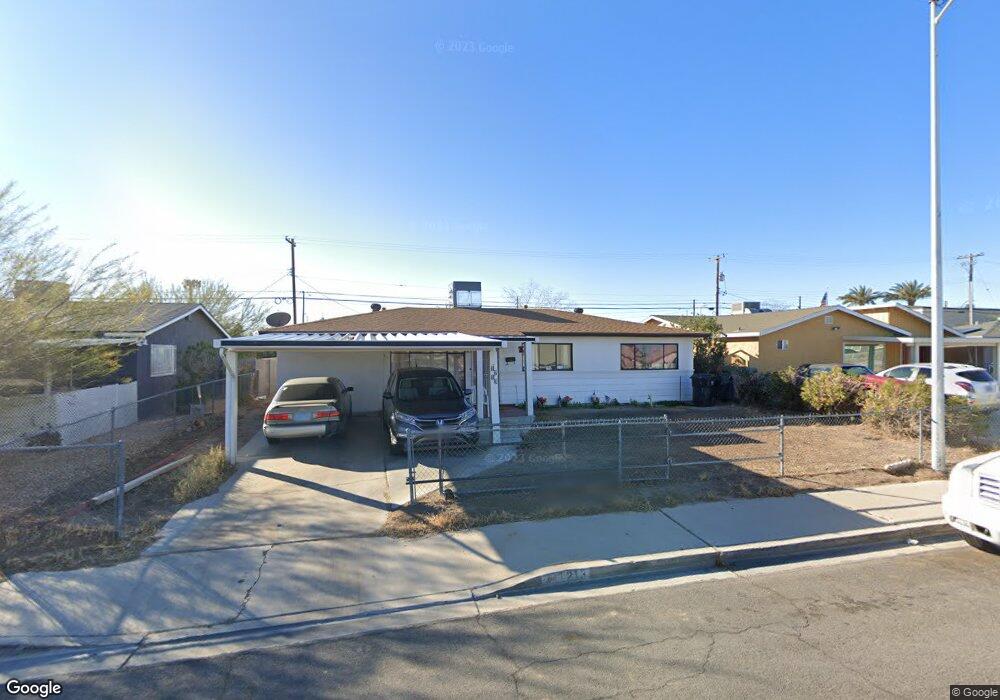
1213 Leonard Ave Las Vegas, NV 89106
West Las Vegas NeighborhoodEstimated Value: $312,116 - $361,000
4
Beds
2
Baths
1,584
Sq Ft
$214/Sq Ft
Est. Value
About This Home
This home is located at 1213 Leonard Ave, Las Vegas, NV 89106 and is currently estimated at $338,529, approximately $213 per square foot. 1213 Leonard Ave is a home located in Clark County with nearby schools including Matt Kelly Elementary School, West Prepatory Academy At Charlles I West Hall Sec, and Canyon Springs High School And The Leadership And.
Ownership History
Date
Name
Owned For
Owner Type
Purchase Details
Closed on
Mar 16, 2021
Sold by
Christensen Rodd B
Bought by
Rodd B And Aleta J Christensen Family Trust and Christensen
Current Estimated Value
Purchase Details
Closed on
Oct 24, 2020
Sold by
Christensen Aleta
Bought by
Christensen Rodd B
Home Financials for this Owner
Home Financials are based on the most recent Mortgage that was taken out on this home.
Original Mortgage
$150,000
Interest Rate
2.8%
Mortgage Type
New Conventional
Purchase Details
Closed on
Aug 25, 2020
Sold by
Christensen I Ray L and Estate Of Ruby Christensen
Bought by
Christensen Rodd B
Home Financials for this Owner
Home Financials are based on the most recent Mortgage that was taken out on this home.
Original Mortgage
$150,000
Interest Rate
2.8%
Mortgage Type
New Conventional
Create a Home Valuation Report for This Property
The Home Valuation Report is an in-depth analysis detailing your home's value as well as a comparison with similar homes in the area
Home Values in the Area
Average Home Value in this Area
Purchase History
| Date | Buyer | Sale Price | Title Company |
|---|---|---|---|
| Rodd B And Aleta J Christensen Family Trust | -- | None Listed On Document | |
| Christensen Rodd B | -- | Driggs Title Agency Inc | |
| Christensen Rodd B | -- | None Available |
Source: Public Records
Mortgage History
| Date | Status | Borrower | Loan Amount |
|---|---|---|---|
| Previous Owner | Christensen Rodd B | $150,000 |
Source: Public Records
Tax History Compared to Growth
Tax History
| Year | Tax Paid | Tax Assessment Tax Assessment Total Assessment is a certain percentage of the fair market value that is determined by local assessors to be the total taxable value of land and additions on the property. | Land | Improvement |
|---|---|---|---|---|
| 2025 | $624 | $46,115 | $26,250 | $19,865 |
| 2024 | $578 | $46,115 | $26,250 | $19,865 |
| 2023 | $578 | $46,018 | $28,000 | $18,018 |
| 2022 | $536 | $35,297 | $19,250 | $16,047 |
| 2021 | $496 | $34,204 | $19,250 | $14,954 |
| 2020 | $458 | $33,793 | $19,250 | $14,543 |
| 2019 | $429 | $26,268 | $12,250 | $14,018 |
| 2018 | $410 | $23,634 | $10,500 | $13,134 |
| 2017 | $748 | $22,811 | $9,800 | $13,011 |
| 2016 | $385 | $16,801 | $4,200 | $12,601 |
| 2015 | $383 | $15,370 | $3,150 | $12,220 |
| 2014 | $371 | $12,914 | $3,150 | $9,764 |
Source: Public Records
Map
Nearby Homes
- 1201 Leonard Ave
- 1101 Leonard Ave
- 1641 K St
- 1636 J St
- 1648 J St
- 1212 Eleanor Ave
- 1121 W Monroe Ave
- 1301 Madison Ave
- 211 Jackson Ave
- 211 W Monroe Ave
- 1219 Cunningham Dr
- 615 Harrison Ave
- 1117 Cunningham Dr
- 1030 W Lake Mead Blvd
- 525 Byrnes Ave
- 616 Bowman Ave
- 1018 I St
- 0 Harrison Ave
- 1249 Hassell Ave
- 1109 H St