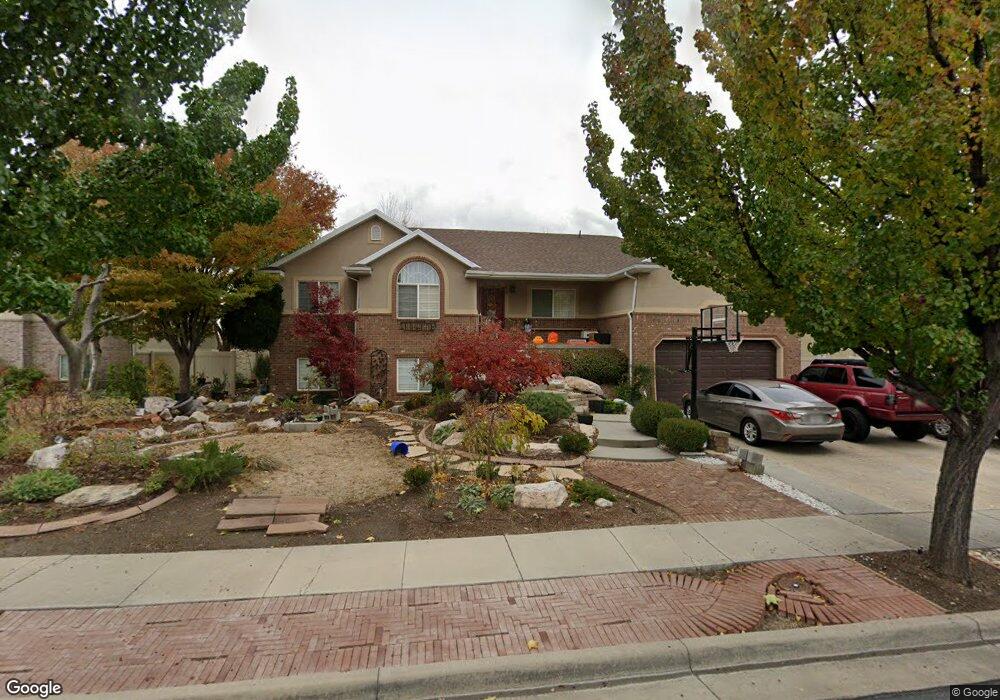
1213 N 640 W West Bountiful, UT 84087
Estimated Value: $556,000 - $655,000
3
Beds
2
Baths
1,651
Sq Ft
$367/Sq Ft
Est. Value
About This Home
This home is located at 1213 N 640 W, West Bountiful, UT 84087 and is currently estimated at $606,194, approximately $367 per square foot. 1213 N 640 W is a home located in Davis County with nearby schools including West Bountiful Elementary School, Bountiful Junior High School, and Viewmont High School.
Ownership History
Date
Name
Owned For
Owner Type
Purchase Details
Closed on
Jan 19, 2005
Sold by
Clinger Construction Inc
Bought by
Purcell Kimberly C and Purcell Paul B
Current Estimated Value
Home Financials for this Owner
Home Financials are based on the most recent Mortgage that was taken out on this home.
Original Mortgage
$169,050
Outstanding Balance
$85,012
Interest Rate
5.69%
Mortgage Type
New Conventional
Estimated Equity
$521,182
Purchase Details
Closed on
Apr 8, 2004
Sold by
Triples Development Inc
Bought by
Clinger Construction Inc
Home Financials for this Owner
Home Financials are based on the most recent Mortgage that was taken out on this home.
Original Mortgage
$192,000
Interest Rate
5.56%
Mortgage Type
Construction
Create a Home Valuation Report for This Property
The Home Valuation Report is an in-depth analysis detailing your home's value as well as a comparison with similar homes in the area
Home Values in the Area
Average Home Value in this Area
Purchase History
| Date | Buyer | Sale Price | Title Company |
|---|---|---|---|
| Purcell Kimberly C | -- | Aspen Title Insurance Agency | |
| Clinger Construction Inc | -- | Aspen Title Ins Agency L |
Source: Public Records
Mortgage History
| Date | Status | Borrower | Loan Amount |
|---|---|---|---|
| Open | Purcell Kimberly C | $169,050 | |
| Previous Owner | Clinger Construction Inc | $192,000 |
Source: Public Records
Tax History Compared to Growth
Tax History
| Year | Tax Paid | Tax Assessment Tax Assessment Total Assessment is a certain percentage of the fair market value that is determined by local assessors to be the total taxable value of land and additions on the property. | Land | Improvement |
|---|---|---|---|---|
| 2025 | $4,079 | $318,450 | $156,962 | $161,488 |
| 2024 | $3,749 | $305,250 | $129,579 | $175,671 |
| 2023 | $3,899 | $588,000 | $241,543 | $346,457 |
| 2022 | $3,941 | $334,951 | $118,718 | $216,233 |
| 2021 | $3,593 | $484,000 | $165,596 | $318,404 |
| 2020 | $3,373 | $430,000 | $149,360 | $280,640 |
| 2019 | $3,282 | $425,000 | $147,376 | $277,624 |
| 2018 | $3,116 | $404,000 | $142,598 | $261,402 |
| 2016 | $2,697 | $188,265 | $42,294 | $145,971 |
| 2015 | $2,793 | $185,845 | $42,294 | $143,551 |
| 2014 | $2,693 | $183,514 | $42,294 | $141,220 |
| 2013 | -- | $158,167 | $51,815 | $106,352 |
Source: Public Records
Map
Nearby Homes
- 637 W 1600 N
- 825 W 1320 N
- 366 W 1000 N
- Lincoln Farmhouse Plan at Belmont Farms
- Belmont Traditional Plan at Belmont Farms
- Hampton Traditional Plan at Belmont Farms
- 790 N 500 W
- 1503 N 300 W
- 235 W 1400 N
- 1194 N 200 W
- 1410 N 200 W
- 789 W 1950 N
- 1260 N 200 W
- 184 Park Shadows Cir
- 340 N 500 W Unit 204
- 1552 N 200 W
- 553 N 200 W
- 399 W 400 N Unit 47
- 810 Park Shadows Cir
- 239 Lyman Ln