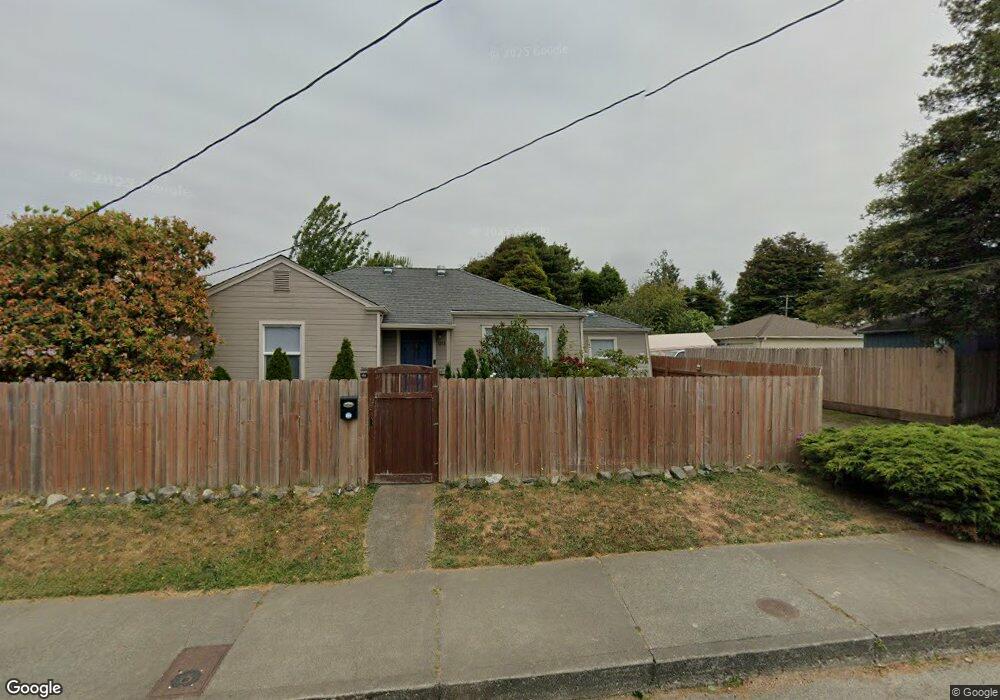
1213 N St Eureka, CA 95501
City Center NeighborhoodEstimated Value: $305,000 - $390,000
2
Beds
1
Bath
850
Sq Ft
$419/Sq Ft
Est. Value
About This Home
This home is located at 1213 N St, Eureka, CA 95501 and is currently estimated at $356,071, approximately $418 per square foot. 1213 N St is a home located in Humboldt County with nearby schools including Washington Elementary School, Catherine L. Zane Middle School, and Eureka Senior High School.
Ownership History
Date
Name
Owned For
Owner Type
Purchase Details
Closed on
Aug 31, 2009
Sold by
Palmer Dennis Gordon and Velda L Palmer Revocable Trust
Bought by
Beltz Melody J
Current Estimated Value
Home Financials for this Owner
Home Financials are based on the most recent Mortgage that was taken out on this home.
Original Mortgage
$184,103
Outstanding Balance
$118,372
Interest Rate
5.18%
Mortgage Type
FHA
Estimated Equity
$237,699
Purchase Details
Closed on
Oct 9, 2003
Sold by
Palmer Velda L
Bought by
Palmer Velda L and Velda L Palmer Revocable Trust
Create a Home Valuation Report for This Property
The Home Valuation Report is an in-depth analysis detailing your home's value as well as a comparison with similar homes in the area
Home Values in the Area
Average Home Value in this Area
Purchase History
| Date | Buyer | Sale Price | Title Company |
|---|---|---|---|
| Beltz Melody J | $187,500 | Humboldt Land Title Company | |
| Palmer Velda L | -- | -- |
Source: Public Records
Mortgage History
| Date | Status | Borrower | Loan Amount |
|---|---|---|---|
| Open | Beltz Melody J | $184,103 |
Source: Public Records
Tax History
| Year | Tax Paid | Tax Assessment Tax Assessment Total Assessment is a certain percentage of the fair market value that is determined by local assessors to be the total taxable value of land and additions on the property. | Land | Improvement |
|---|---|---|---|---|
| 2025 | $2,416 | $242,016 | $122,620 | $119,396 |
| 2024 | $2,416 | $237,271 | $120,216 | $117,055 |
| 2023 | $2,380 | $232,619 | $117,859 | $114,760 |
| 2022 | $2,469 | $228,059 | $115,549 | $112,510 |
| 2021 | $2,311 | $223,588 | $113,284 | $110,304 |
| 2020 | $2,293 | $221,296 | $112,123 | $109,173 |
| 2019 | $2,244 | $216,958 | $109,925 | $107,033 |
| 2018 | $2,209 | $212,705 | $107,770 | $104,935 |
| 2017 | $2,197 | $208,535 | $105,657 | $102,878 |
| 2016 | $2,196 | $204,447 | $103,586 | $100,861 |
| 2015 | $2,175 | $201,377 | $102,031 | $99,346 |
| 2014 | $2,032 | $197,433 | $100,033 | $97,400 |
Source: Public Records
Map
Nearby Homes
Your Personal Tour Guide
Ask me questions while you tour the home.