Estimated Value: $289,000 - $332,000
3
Beds
2
Baths
1,538
Sq Ft
$196/Sq Ft
Est. Value
About This Home
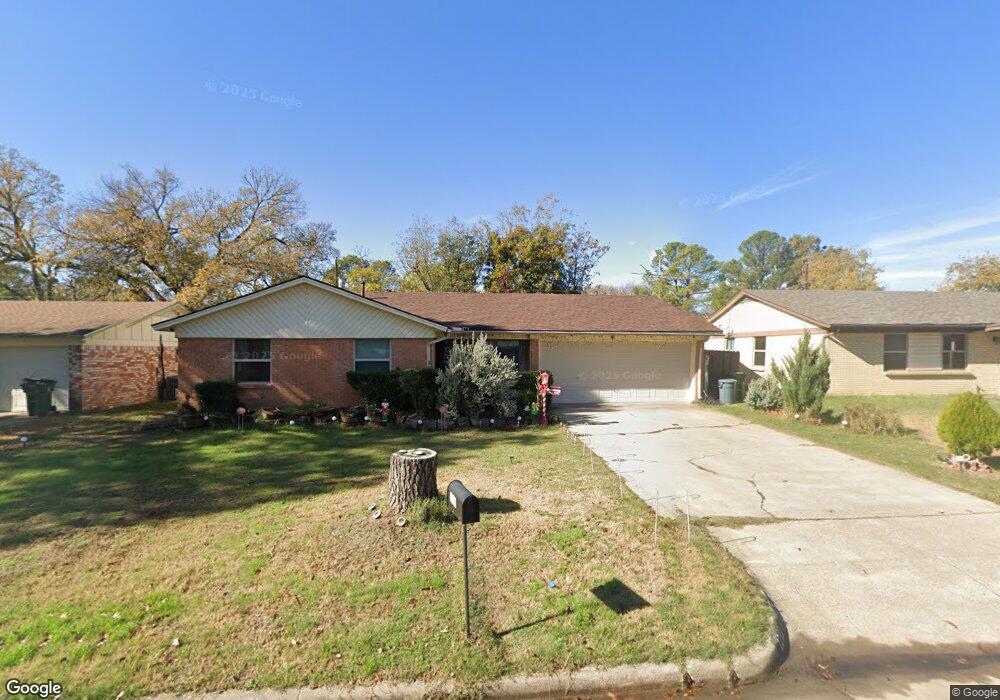
This home is located at 1213 Norwood Dr, Hurst, TX 76053 and is currently estimated at $301,237, approximately $195 per square foot. 1213 Norwood Dr is a home located in Tarrant County with nearby schools including Harrison Lane Elementary School, Hurst J High School, and L.D. Bell High School.
Ownership History
Date
Name
Owned For
Owner Type
Purchase Details
Closed on
Jul 14, 2017
Sold by
505 Harmon Road Llc
Bought by
Neavin Brian E and Frquharson Rosita A
Current Estimated Value
Home Financials for this Owner
Home Financials are based on the most recent Mortgage that was taken out on this home.
Original Mortgage
$178,703
Outstanding Balance
$151,849
Interest Rate
4.75%
Mortgage Type
FHA
Estimated Equity
$149,388
Purchase Details
Closed on
Feb 17, 2017
Sold by
Lawson Sane M and Lawson Jennifer E
Bought by
505 Harmon Road Llc
Purchase Details
Closed on
May 30, 2006
Sold by
Mcfarland Johnny W and Mcfarland Laura J
Bought by
Lawson Shane M and Lawson Jennifer E
Home Financials for this Owner
Home Financials are based on the most recent Mortgage that was taken out on this home.
Original Mortgage
$46,700
Interest Rate
6.5%
Mortgage Type
Seller Take Back
Create a Home Valuation Report for This Property
The Home Valuation Report is an in-depth analysis detailing your home's value as well as a comparison with similar homes in the area
Home Values in the Area
Average Home Value in this Area
Purchase History
| Date | Buyer | Sale Price | Title Company |
|---|---|---|---|
| Neavin Brian E | -- | None Available | |
| 505 Harmon Road Llc | -- | Lawyers Title | |
| Lawson Shane M | -- | Stewart Title |
Source: Public Records
Mortgage History
| Date | Status | Borrower | Loan Amount |
|---|---|---|---|
| Open | Neavin Brian E | $178,703 | |
| Previous Owner | Lawson Shane M | $46,700 |
Source: Public Records
Tax History Compared to Growth
Tax History
| Year | Tax Paid | Tax Assessment Tax Assessment Total Assessment is a certain percentage of the fair market value that is determined by local assessors to be the total taxable value of land and additions on the property. | Land | Improvement |
|---|---|---|---|---|
| 2025 | $3,376 | $234,555 | $55,000 | $179,555 |
| 2024 | $3,376 | $262,747 | $55,000 | $207,747 |
| 2023 | $4,330 | $246,022 | $35,000 | $211,022 |
| 2022 | $4,524 | $211,805 | $35,000 | $176,805 |
| 2021 | $4,308 | $205,684 | $35,000 | $170,684 |
| 2020 | $3,907 | $162,389 | $35,000 | $127,389 |
| 2019 | $4,090 | $167,121 | $35,000 | $132,121 |
| 2018 | $3,776 | $178,348 | $16,000 | $162,348 |
| 2017 | $2,247 | $126,587 | $16,000 | $110,587 |
| 2016 | $2,043 | $103,204 | $16,000 | $87,204 |
| 2015 | $1,561 | $73,400 | $15,000 | $58,400 |
| 2014 | $1,561 | $73,400 | $15,000 | $58,400 |
Source: Public Records
Map
Nearby Homes
- 1220 Norwood Dr
- 116 Oakhurst Dr
- 1337 Harrison Ln
- 1348 Norwood Dr
- 1136 Simpson Dr
- 1352 Simpson Dr
- 409 Vicki Place
- 113 Sunnyvale Terrace
- 905 Brown Trail
- 420 Bedford Ct W
- 344 Bedford Ct E
- 1016 Keith Dr
- 341 Hurst Dr
- 1208 Karla Dr
- 1236 King Dr
- 400 Joanna Dr
- 1008 Russell Ln
- 802 Brown Trail
- 803 Glenda Dr
- 49 Coffee Tavern Rd
- 1217 Norwood Dr
- 1209 Norwood Dr
- 1212 Simpson Dr
- 1221 Norwood Dr
- 1216 Simpson Dr
- 1205 Norwood Dr
- 1208 Simpson Dr
- 1216 Norwood Dr
- 1208 Norwood Dr
- 1220 Simpson Dr
- 1204 Simpson Dr
- 1225 Norwood Dr
- 1201 Norwood Dr
- 1204 Norwood Dr
- 1200 Simpson Dr
- 1224 Norwood Dr
- 1200 Norwood Dr
- 1229 Norwood Dr
- 1209 Valley View Ct
- 1213 Valley View Ct