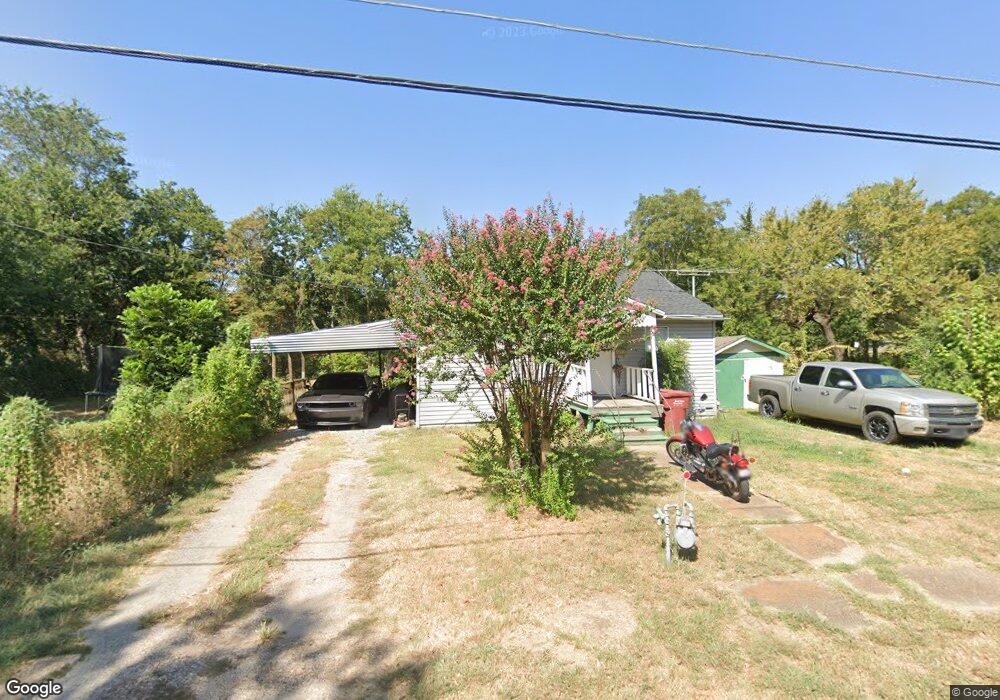
1213 Oak St Bonham, TX 75418
Estimated Value: $124,746 - $142,000
--
Bed
--
Bath
1,168
Sq Ft
$112/Sq Ft
Est. Value
About This Home
This home is located at 1213 Oak St, Bonham, TX 75418 and is currently estimated at $130,937, approximately $112 per square foot. 1213 Oak St is a home located in Fannin County with nearby schools including Finley-Oates Elementary School, LH Rather Jr High School, and Morning Star Academy.
Ownership History
Date
Name
Owned For
Owner Type
Purchase Details
Closed on
Sep 30, 2020
Sold by
Owner Financing Of Texas Llc
Bought by
Munguia Sergio Juarez
Current Estimated Value
Purchase Details
Closed on
Jul 21, 2020
Sold by
Velasquez Blanca A
Bought by
Velasquez Blanca A and Flores Robert
Purchase Details
Closed on
Sep 11, 2018
Sold by
Martinez Edil
Bought by
Velasquez Blanca and Velasquez Blanca A
Create a Home Valuation Report for This Property
The Home Valuation Report is an in-depth analysis detailing your home's value as well as a comparison with similar homes in the area
Home Values in the Area
Average Home Value in this Area
Purchase History
| Date | Buyer | Sale Price | Title Company |
|---|---|---|---|
| Munguia Sergio Juarez | -- | Cole Title Co | |
| Velasquez Blanca A | -- | Main Street Title | |
| Velasquez Blanca | -- | Main Street Title |
Source: Public Records
Tax History Compared to Growth
Tax History
| Year | Tax Paid | Tax Assessment Tax Assessment Total Assessment is a certain percentage of the fair market value that is determined by local assessors to be the total taxable value of land and additions on the property. | Land | Improvement |
|---|---|---|---|---|
| 2025 | $1,594 | $89,040 | $49,850 | $39,190 |
| 2024 | $1,594 | $82,170 | $47,930 | $34,240 |
| 2023 | $1,569 | $79,580 | $44,100 | $35,480 |
| 2022 | $1,430 | $65,000 | $31,160 | $33,840 |
| 2021 | $1,081 | $42,760 | $14,860 | $27,900 |
| 2020 | $989 | $38,700 | $11,980 | $26,720 |
| 2019 | $916 | $34,460 | $9,590 | $24,870 |
| 2018 | $893 | $33,660 | $9,110 | $24,550 |
| 2017 | $756 | $29,570 | $5,270 | $24,300 |
| 2016 | $748 | $29,270 | $5,270 | $24,000 |
| 2015 | -- | $24,000 | $5,030 | $18,970 |
| 2014 | -- | $24,250 | $4,790 | $19,460 |
Source: Public Records
Map
Nearby Homes