Estimated Value: $233,000 - $278,000
About This Home
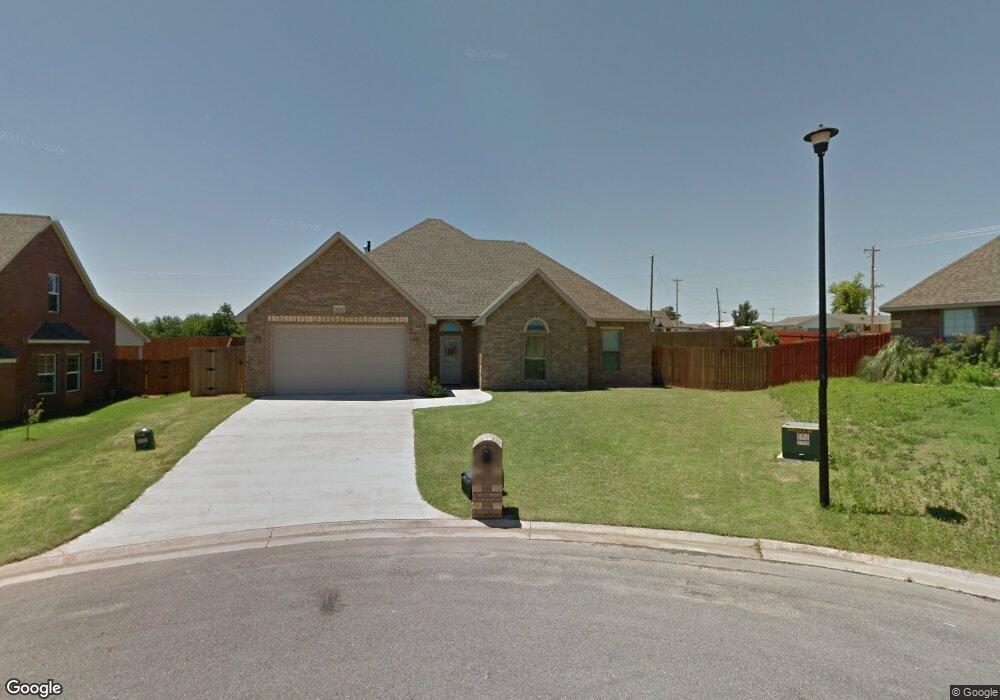
This home is located at 1213 Red Rock Dr, Elgin, OK 73538 and is currently estimated at $264,664, approximately $147 per square foot. 1213 Red Rock Dr is a home located in Comanche County with nearby schools including Elgin Elementary School, Elgin Middle School, and Elgin High School.
Ownership History
We collect this data history from publicly available records. To have your information removed, we recommend requesting removal directly through your county’s website.
Purchase Details
Home Financials for this Owner
Home Financials are based on the most recent Mortgage that was taken out on this home.Purchase Details
Home Financials for this Owner
Home Financials are based on the most recent Mortgage that was taken out on this home.Purchase Details
Home Financials for this Owner
Home Financials are based on the most recent Mortgage that was taken out on this home.Home Values in the Area
Average Home Value in this Area
Purchase History
We collect this data history from publicly available records. To have your information removed, we recommend requesting removal directly through your county’s website.
| Date | Buyer | Sale Price | Title Company |
|---|---|---|---|
| $265,000 | Sovereign Title | ||
| $190,000 | -- | ||
| $21,500 | -- |
Mortgage History
We collect this data history from publicly available records. To have your information removed, we recommend requesting removal directly through your county’s website.
| Date | Status | Borrower | Loan Amount |
|---|---|---|---|
| Open | $273,745 | ||
| Previous Owner | $186,459 | ||
| Previous Owner | $145,574 |
Tax History
We collect this data history from publicly available records. To have your information removed, we recommend requesting removal directly through your county’s website.
| Year | Tax Paid | Tax Assessment Tax Assessment Total Assessment is a certain percentage of the fair market value that is determined by local assessors to be the total taxable value of land and additions on the property. | Land | Improvement |
|---|---|---|---|---|
| 2025 | $2,969 | $29,352 | $5,625 | $23,727 |
| 2024 | $2,204 | $27,675 | $4,500 | $23,175 |
| 2023 | $2,204 | $21,337 | $3,825 | $17,512 |
| 2022 | $2,068 | $20,716 | $3,825 | $16,891 |
| 2021 | $2,105 | $20,716 | $3,825 | $16,891 |
| 2020 | $1,948 | $20,359 | $3,825 | $16,534 |
| 2019 | $2,199 | $21,160 | $3,825 | $17,335 |
| 2018 | $2,193 | $21,160 | $3,825 | $17,335 |
| 2017 | $2,065 | $20,836 | $3,150 | $17,686 |
| 2016 | $2,026 | $20,635 | $3,150 | $17,485 |
| 2015 | $2,092 | $21,328 | $2,475 | $18,853 |
| 2014 | $2,048 | $21,328 | $2,475 | $18,853 |
Map
- 1414 Limestone Way
- 1430 Limestone Way
- 1420 Limestone Way
- 12872 NE Keeney Rd
- 1105 4th Place
- 205 Oak St
- 1215 Hershel Dr
- 89 NE Deerfield Dr
- 208 K St
- 1206 Hershel Dr
- 910 4th St
- 11 NE Summerwood Dr
- 39 NE Deerfield Dr
- 102 K St
- 1220 Cypress Ln
- 910 1st St
- 704 6th St
- 802 Waverly Way
- 13111 Bentley Dr
- 509 G St
- 1319 Saddle Rock Dr
- 1209 Red Rock Dr
- 1241 Red Rock Dr
- 1321 Saddle Rock Dr
- 1317 Saddle Rock Dr
- 1329 Saddle Rock Dr
- 1246 Red Rock Dr
- 1201 Pebble Trail
- 1205 Red Rock Dr
- 1217 Red Rock Dr
- 1327 Saddle Rock Dr
- 1313 Saddle Rock Dr
- 1235 Red Rock Dr
- 1244 Red Rock Dr
- 1331 Saddle Rock Dr
- 1221 Red Rock Dr
- 1201 Red Rock Dr
- 1233 Red Rock Dr
- 1225 Red Rock Dr
- 1213 Pebble Trail
Ask me questions while you tour the home.