Estimated Value: $65,849 - $118,000
3
Beds
1
Bath
1,281
Sq Ft
$70/Sq Ft
Est. Value
About This Home
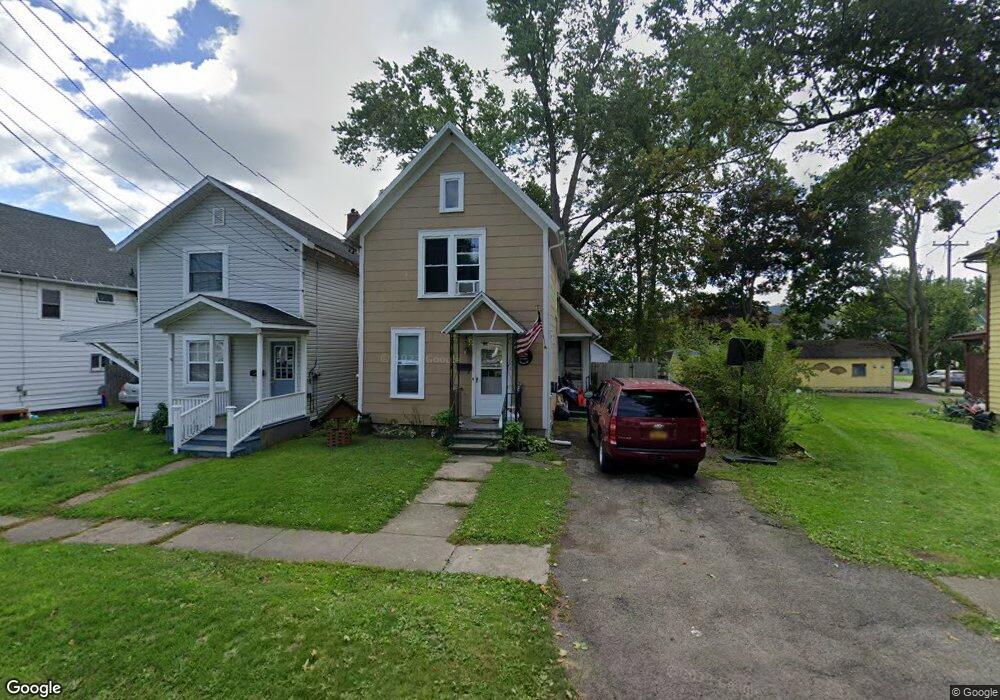
This home is located at 1213 Reed St, Olean, NY 14760 and is currently estimated at $90,212, approximately $70 per square foot. 1213 Reed St is a home located in Cattaraugus County with nearby schools including Olean Intermediate-Middle School, Olean Senior High School, and Southern Tier Catholic School.
Ownership History
Date
Name
Owned For
Owner Type
Purchase Details
Closed on
Sep 13, 2013
Sold by
Dwaileebe Charles J
Bought by
Russell James C
Current Estimated Value
Purchase Details
Closed on
Jul 1, 2013
Sold by
Simons John M
Bought by
Dwaileebe Charles J
Purchase Details
Closed on
Mar 11, 2010
Sold by
Jackson Robert
Bought by
Simons John
Create a Home Valuation Report for This Property
The Home Valuation Report is an in-depth analysis detailing your home's value as well as a comparison with similar homes in the area
Home Values in the Area
Average Home Value in this Area
Purchase History
| Date | Buyer | Sale Price | Title Company |
|---|---|---|---|
| Russell James C | $31,000 | -- | |
| Dwaileebe Charles J | $12,500 | -- | |
| Simons John | $31,000 | Gregory Shemeld |
Source: Public Records
Tax History
| Year | Tax Paid | Tax Assessment Tax Assessment Total Assessment is a certain percentage of the fair market value that is determined by local assessors to be the total taxable value of land and additions on the property. | Land | Improvement |
|---|---|---|---|---|
| 2025 | $2,845 | $45,000 | $3,000 | $42,000 |
| 2024 | $2,845 | $45,000 | $3,000 | $42,000 |
| 2023 | $1,694 | $45,000 | $3,000 | $42,000 |
| 2022 | $1,719 | $45,000 | $3,000 | $42,000 |
| 2021 | $1,768 | $45,000 | $3,000 | $42,000 |
| 2020 | $1,781 | $45,000 | $3,000 | $42,000 |
| 2019 | $675 | $45,000 | $3,000 | $42,000 |
| 2018 | $4,684 | $45,000 | $3,000 | $42,000 |
| 2017 | $2,985 | $45,000 | $3,000 | $42,000 |
| 2016 | $3,816 | $45,000 | $3,000 | $42,000 |
| 2015 | -- | $45,000 | $3,000 | $42,000 |
| 2014 | -- | $45,000 | $3,000 | $42,000 |
Source: Public Records
Map
Nearby Homes
Your Personal Tour Guide
Ask me questions while you tour the home.