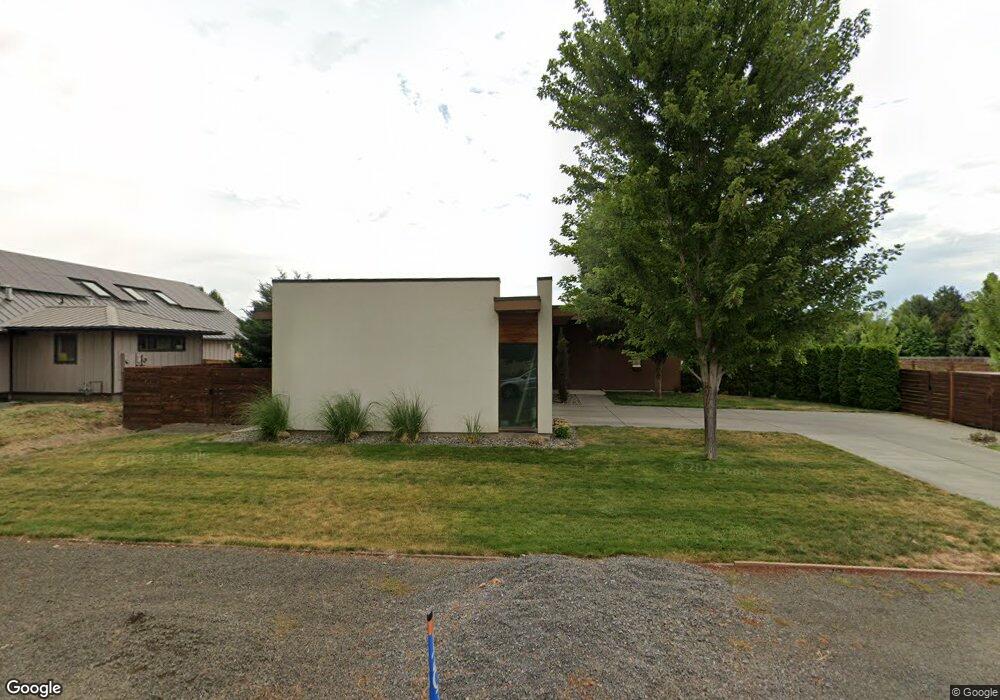
1213 S Hussey St Walla Walla, WA 99362
Estimated Value: $681,000 - $735,796
3
Beds
4
Baths
2,691
Sq Ft
$266/Sq Ft
Est. Value
About This Home
This home is located at 1213 S Hussey St, Walla Walla, WA 99362 and is currently estimated at $715,949, approximately $266 per square foot. 1213 S Hussey St is a home located in Walla Walla County with nearby schools including Davis Elementary School, John Sager Middle School, and Liberty Christian School.
Ownership History
Date
Name
Owned For
Owner Type
Purchase Details
Closed on
Jul 27, 2017
Sold by
Perkins Marci
Bought by
Car Robert
Current Estimated Value
Purchase Details
Closed on
Aug 27, 2007
Sold by
Munoz Manuel A
Bought by
Car Robert
Home Financials for this Owner
Home Financials are based on the most recent Mortgage that was taken out on this home.
Original Mortgage
$46,000
Interest Rate
6.41%
Mortgage Type
Unknown
Purchase Details
Closed on
Jul 11, 2007
Sold by
Munoz Manuel A and Munoz Julie
Bought by
Munoz Manuel A
Home Financials for this Owner
Home Financials are based on the most recent Mortgage that was taken out on this home.
Original Mortgage
$46,000
Interest Rate
6.41%
Mortgage Type
Unknown
Purchase Details
Closed on
Aug 30, 2006
Sold by
Wenham Anthony K
Bought by
Munoz Manuel and Munoz Julie
Purchase Details
Closed on
Jul 29, 2004
Sold by
Ponti R Gary and Ponti Albert Bob C
Bought by
Wenham Anthony K
Create a Home Valuation Report for This Property
The Home Valuation Report is an in-depth analysis detailing your home's value as well as a comparison with similar homes in the area
Home Values in the Area
Average Home Value in this Area
Purchase History
| Date | Buyer | Sale Price | Title Company |
|---|---|---|---|
| Car Robert | -- | Land Title Of Walla Walla Co | |
| Car Robert | $110,000 | Land Title Of Walla Walla Co | |
| Munoz Manuel A | -- | None Available | |
| Munoz Manuel | $100,000 | Land Title Of Walla Walla Co | |
| Wenham Anthony K | $44,673 | Land Title Of Walla Walla Co |
Source: Public Records
Mortgage History
| Date | Status | Borrower | Loan Amount |
|---|---|---|---|
| Previous Owner | Munoz Manuel A | $46,000 |
Source: Public Records
Tax History Compared to Growth
Tax History
| Year | Tax Paid | Tax Assessment Tax Assessment Total Assessment is a certain percentage of the fair market value that is determined by local assessors to be the total taxable value of land and additions on the property. | Land | Improvement |
|---|---|---|---|---|
| 2024 | $6,915 | $643,910 | $107,020 | $536,890 |
| 2023 | $6,915 | $538,760 | $107,020 | $431,740 |
| 2022 | $6,925 | $538,760 | $107,020 | $431,740 |
| 2021 | $5,718 | $482,450 | $107,020 | $375,430 |
| 2020 | $5,570 | $349,230 | $107,020 | $242,210 |
| 2019 | $4,753 | $349,230 | $75,000 | $274,230 |
| 2018 | $5,639 | $324,300 | $75,000 | $249,300 |
| 2017 | $5,261 | $324,300 | $75,000 | $249,300 |
| 2016 | $3,926 | $324,300 | $75,000 | $249,300 |
| 2015 | $3,729 | $227,400 | $75,000 | $152,400 |
| 2014 | -- | $227,400 | $75,000 | $152,400 |
| 2013 | -- | $227,400 | $75,000 | $152,400 |
Source: Public Records
Map
Nearby Homes
- 609 W Whitman Dr
- 28 SW Evans Ave
- 136 Blalock Dr
- 247 NW Laurella Ln
- 220 Blalock Dr
- 604 SW 4th St
- 40 NW B St
- 314 SW Homestead Ave
- 1254 SW Settlement St
- 70 NE Rose St
- 1450 SW Greeley St
- 123 NE C St
- 0 York St Unit NWM2428794
- 160 NE Rose St
- 214 E Whitman Dr
- 218 E Whitman Dr
- 226 E Whitman Dr
- 238 N East Damson Place
- 919 Stanley Dr
- 210 SE 4th St