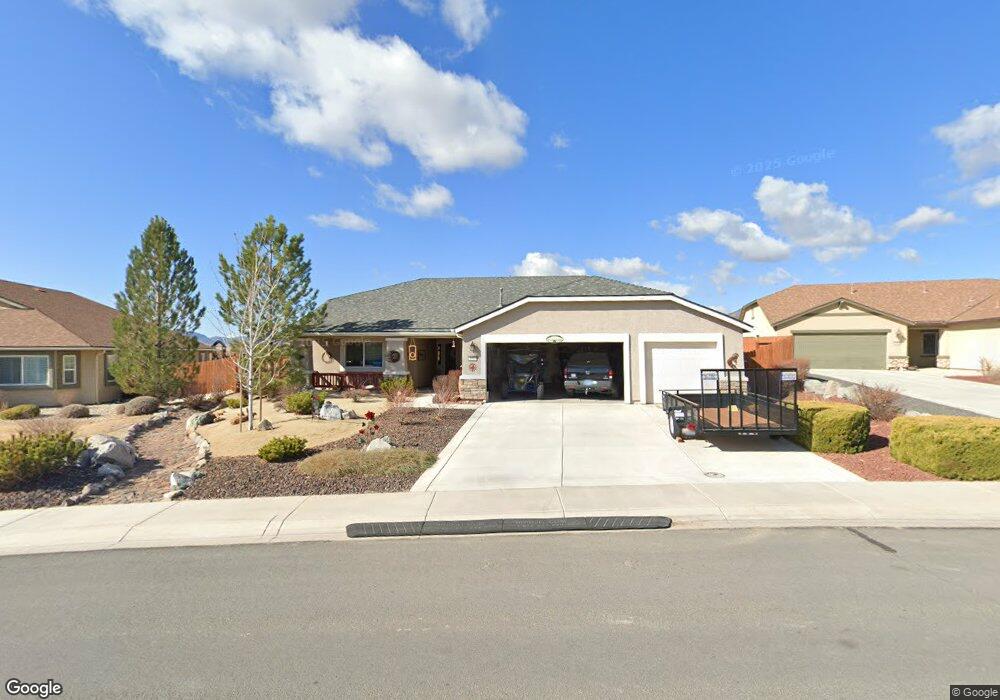
1213 Stratton Dr Unit 13 Dayton, NV 89403
Estimated Value: $541,985 - $566,000
3
Beds
2
Baths
2,212
Sq Ft
$253/Sq Ft
Est. Value
About This Home
This home is located at 1213 Stratton Dr Unit 13, Dayton, NV 89403 and is currently estimated at $559,496, approximately $252 per square foot. 1213 Stratton Dr Unit 13 is a home located in Lyon County with nearby schools including Riverview Elementary School, Dayton Intermediate School, and Dayton High School.
Ownership History
Date
Name
Owned For
Owner Type
Purchase Details
Closed on
Feb 23, 2011
Sold by
Lennar Reno Llc
Bought by
Zabolocky Lyle W and Zabolocky Judith A
Current Estimated Value
Home Financials for this Owner
Home Financials are based on the most recent Mortgage that was taken out on this home.
Original Mortgage
$172,814
Outstanding Balance
$117,633
Interest Rate
4.67%
Estimated Equity
$441,863
Purchase Details
Closed on
Apr 7, 2010
Sold by
Columbus Riverpark Llc
Bought by
Lennar Reno Llc
Purchase Details
Closed on
Oct 9, 2008
Sold by
Gmac Model Home Finance Llc
Bought by
Doa Properties Vii Lots Nv Llc
Purchase Details
Closed on
Aug 17, 2008
Sold by
Doa Properties Vii Lots Nv Llc
Bought by
Columbus Riverpark Llc
Purchase Details
Closed on
Jun 9, 2008
Sold by
Gmac Model Home Finance Llc
Bought by
Doa Properties Vii Lots Nv Llc
Create a Home Valuation Report for This Property
The Home Valuation Report is an in-depth analysis detailing your home's value as well as a comparison with similar homes in the area
Home Values in the Area
Average Home Value in this Area
Purchase History
| Date | Buyer | Sale Price | Title Company |
|---|---|---|---|
| Zabolocky Lyle W | $213,352 | North American Title Co Inc | |
| Lennar Reno Llc | $927,500 | Western Title | |
| Doa Properties Vii Lots Nv Llc | -- | Accommodation | |
| Columbus Riverpark Llc | $1,985,851 | First American Title Reno | |
| Doa Properties Vii Lots Nv Llc | $1,985,851 | First American Title Company |
Source: Public Records
Mortgage History
| Date | Status | Borrower | Loan Amount |
|---|---|---|---|
| Open | Zabolocky Lyle W | $172,814 |
Source: Public Records
Tax History
| Year | Tax Paid | Tax Assessment Tax Assessment Total Assessment is a certain percentage of the fair market value that is determined by local assessors to be the total taxable value of land and additions on the property. | Land | Improvement |
|---|---|---|---|---|
| 2025 | $3,506 | $156,784 | $52,500 | $104,284 |
| 2024 | $3,404 | $157,232 | $52,500 | $104,732 |
| 2023 | $3,404 | $150,116 | $52,500 | $97,616 |
| 2022 | $2,740 | $135,145 | $45,270 | $89,875 |
| 2021 | $2,537 | $128,627 | $41,160 | $87,467 |
| 2020 | $2,349 | $124,643 | $41,160 | $83,483 |
| 2019 | $2,201 | $105,336 | $25,730 | $79,606 |
| 2018 | $2,097 | $94,594 | $17,150 | $77,444 |
| 2017 | $2,012 | $85,865 | $8,580 | $77,285 |
| 2016 | $1,961 | $76,469 | $5,780 | $70,689 |
| 2015 | $1,957 | $64,005 | $5,780 | $58,225 |
| 2014 | $1,896 | $58,733 | $5,780 | $52,953 |
Source: Public Records
Map
Nearby Homes
- 1502 Riverpark Pkwy
- 1145 Cheatgrass Dr
- 915 Saltbrush Rd
- 126 Hood Dr
- 135 Deschutes Dr Unit 2
- 148 Snake Rd
- 1518 Sequoia St
- 99 Rogue
- 1180 Ferretto Pkwy
- 809 Egan Canyon Rd
- 201 Verre Ct
- 429 Keystone Dr
- 196 Six Mile Canyon Rd
- 702 Ophir Ct
- 211 Shady Grove Ln
- 329 River Rd
- 73 S Rainbow Dr Unit Lot B
- 80 S Pinenut Dr
- 275 Imperial Rd
- 808 Brandy Ct
- 1211 Stratton Dr
- 1215 Stratton Dr
- 1155 Cheatgrass Dr
- 1155 Cheatgrass Dr Unit Lot 208
- 1155 Cheatgrass Dr
- 1157 Cheatgrass Dr
- 1217 Stratton Dr
- 1159 Cheatgrass Dr
- 1159 Cheatgrass Dr Unit Lot 210
- 1153 Cheatgrass Dr
- 1153 Cheatgrass Dr Unit Lot 207
- 1111 Ferretto Pkwy
- 1366 Grassland Rd
- 1368 Grassland Rd
- 1364 Grassland Rd
- 1219 Stratton Dr
- 1161 Cheatgrass Dr Unit Lot 211
- 1161 Cheatgrass Dr
- 1362 Grassland Rd
- 1372 Grassland Rd
Your Personal Tour Guide
Ask me questions while you tour the home.