Estimated Value: $444,000 - $481,000
3
Beds
3
Baths
1,648
Sq Ft
$282/Sq Ft
Est. Value
About This Home
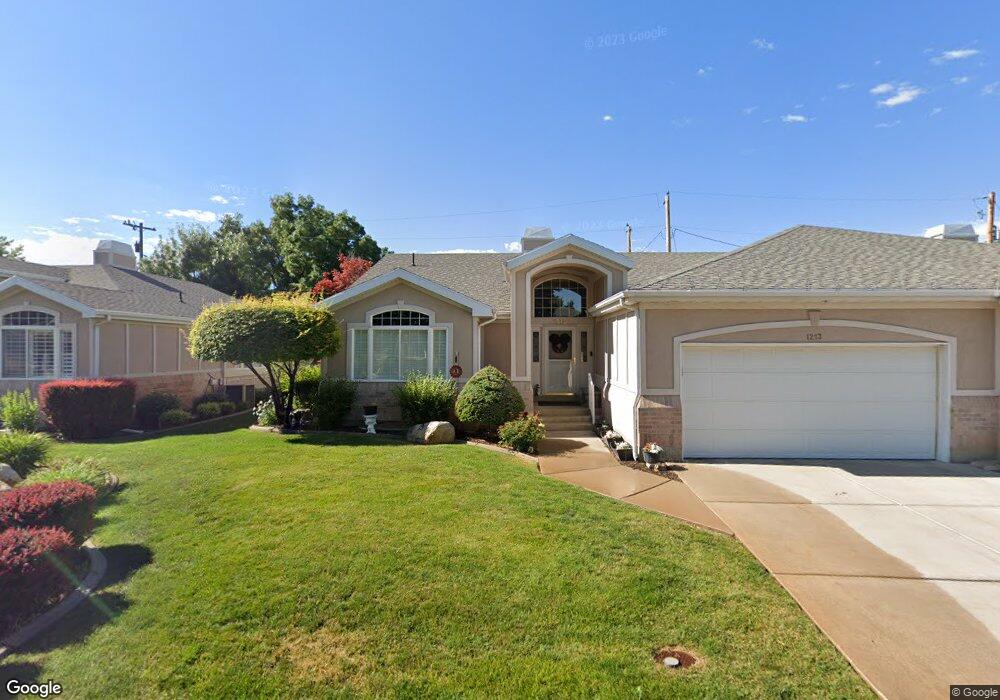
This home is located at 1213 W 4550 S, Ogden, UT 84405 and is currently estimated at $465,235, approximately $282 per square foot. 1213 W 4550 S is a home located in Weber County with nearby schools including Riverdale School, T.H. Bell Junior High School, and Bonneville High School.
Ownership History
Date
Name
Owned For
Owner Type
Purchase Details
Closed on
Mar 27, 2018
Sold by
Stokes Terry L and Stokes Linda J
Bought by
Stokes Terry L and Stokes Linda J
Current Estimated Value
Purchase Details
Closed on
Feb 19, 1999
Sold by
Opeikens & Company Inc
Bought by
Madson J Michael
Home Financials for this Owner
Home Financials are based on the most recent Mortgage that was taken out on this home.
Original Mortgage
$139,600
Interest Rate
6.78%
Create a Home Valuation Report for This Property
The Home Valuation Report is an in-depth analysis detailing your home's value as well as a comparison with similar homes in the area
Home Values in the Area
Average Home Value in this Area
Purchase History
| Date | Buyer | Sale Price | Title Company |
|---|---|---|---|
| Stokes Terry L | -- | None Available | |
| Madson J Michael | -- | Bonneville Title Company |
Source: Public Records
Mortgage History
| Date | Status | Borrower | Loan Amount |
|---|---|---|---|
| Closed | Madson J Michael | $139,600 |
Source: Public Records
Tax History Compared to Growth
Tax History
| Year | Tax Paid | Tax Assessment Tax Assessment Total Assessment is a certain percentage of the fair market value that is determined by local assessors to be the total taxable value of land and additions on the property. | Land | Improvement |
|---|---|---|---|---|
| 2025 | $2,426 | $429,130 | $100,000 | $329,130 |
| 2024 | $2,310 | $229,900 | $55,000 | $174,900 |
| 2023 | $2,513 | $248,050 | $55,000 | $193,050 |
| 2022 | $2,541 | $255,750 | $55,000 | $200,750 |
| 2021 | $1,934 | $356,000 | $75,000 | $281,000 |
| 2020 | $2,007 | $341,000 | $50,000 | $291,000 |
| 2019 | $1,828 | $294,000 | $42,000 | $252,000 |
| 2018 | $1,853 | $285,000 | $42,000 | $243,000 |
| 2017 | $1,552 | $228,000 | $42,000 | $186,000 |
| 2016 | $1,570 | $125,400 | $24,227 | $101,173 |
| 2015 | $1,555 | $121,000 | $24,227 | $96,773 |
| 2014 | $1,226 | $94,600 | $24,227 | $70,373 |
Source: Public Records
Map
Nearby Homes