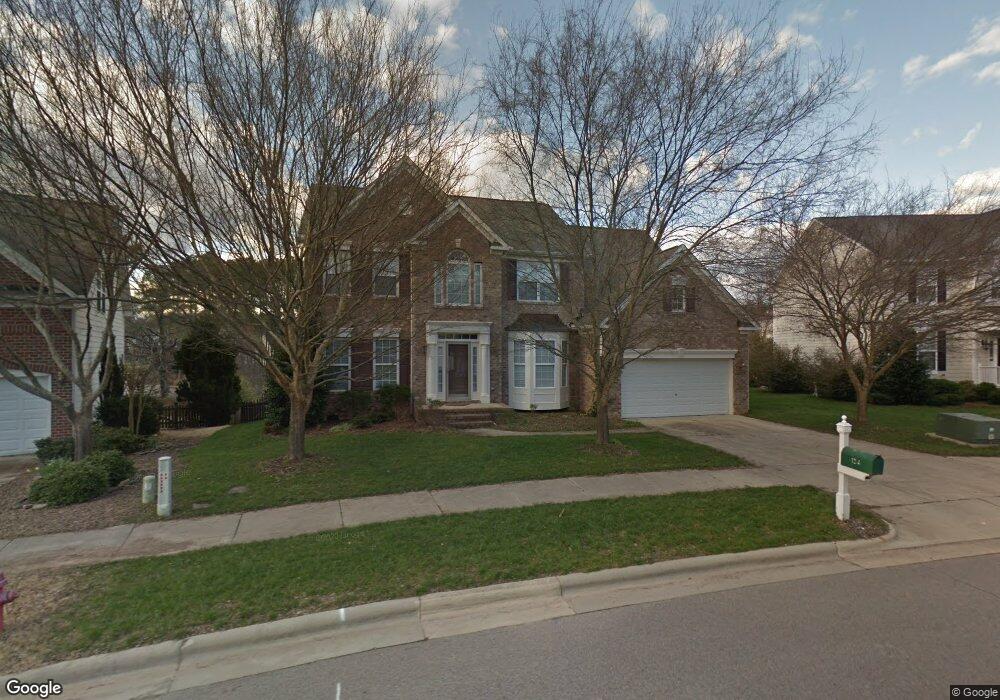
1214 Caribou Crossing Durham, NC 27713
Estimated Value: $716,000 - $753,000
4
Beds
4
Baths
3,148
Sq Ft
$233/Sq Ft
Est. Value
About This Home
This home is located at 1214 Caribou Crossing, Durham, NC 27713 and is currently estimated at $732,525, approximately $232 per square foot. 1214 Caribou Crossing is a home located in Durham County with nearby schools including Lowe's Grove Middle, Hillside High School, and Kestrel Heights School.
Ownership History
Date
Name
Owned For
Owner Type
Purchase Details
Closed on
Jan 16, 2014
Sold by
Wing Michael W and Wing Sarit G
Bought by
Shenvi Christina and Shenvi Neil
Current Estimated Value
Home Financials for this Owner
Home Financials are based on the most recent Mortgage that was taken out on this home.
Original Mortgage
$167,000
Outstanding Balance
$47,205
Interest Rate
4.43%
Mortgage Type
New Conventional
Estimated Equity
$685,320
Purchase Details
Closed on
Jan 3, 2007
Sold by
Wing Michael W and Wing Sarit G
Bought by
Wing Michael W and Wing Sarit G
Purchase Details
Closed on
Dec 13, 2005
Sold by
Foster Elmore C and Foster Angel
Bought by
Wing Michael W
Home Financials for this Owner
Home Financials are based on the most recent Mortgage that was taken out on this home.
Original Mortgage
$335,250
Interest Rate
7.12%
Mortgage Type
New Conventional
Purchase Details
Closed on
Dec 20, 2002
Sold by
The Drees Company
Bought by
Foster Elmore C and Foster Angel
Home Financials for this Owner
Home Financials are based on the most recent Mortgage that was taken out on this home.
Original Mortgage
$264,000
Interest Rate
6.07%
Create a Home Valuation Report for This Property
The Home Valuation Report is an in-depth analysis detailing your home's value as well as a comparison with similar homes in the area
Home Values in the Area
Average Home Value in this Area
Purchase History
| Date | Buyer | Sale Price | Title Company |
|---|---|---|---|
| Shenvi Christina | $330,000 | None Available | |
| Wing Michael W | -- | None Available | |
| Wing Michael W | $372,500 | -- | |
| Foster Elmore C | $330,500 | -- |
Source: Public Records
Mortgage History
| Date | Status | Borrower | Loan Amount |
|---|---|---|---|
| Open | Shenvi Christina | $167,000 | |
| Previous Owner | Wing Michael W | $335,250 | |
| Previous Owner | Foster Elmore C | $264,000 |
Source: Public Records
Tax History Compared to Growth
Tax History
| Year | Tax Paid | Tax Assessment Tax Assessment Total Assessment is a certain percentage of the fair market value that is determined by local assessors to be the total taxable value of land and additions on the property. | Land | Improvement |
|---|---|---|---|---|
| 2025 | $6,412 | $646,847 | $178,750 | $468,097 |
| 2024 | $5,226 | $374,663 | $81,375 | $293,288 |
| 2023 | $4,908 | $374,663 | $81,375 | $293,288 |
| 2022 | $4,795 | $374,663 | $81,375 | $293,288 |
| 2021 | $4,773 | $374,663 | $81,375 | $293,288 |
| 2020 | $4,660 | $374,663 | $81,375 | $293,288 |
| 2019 | $4,482 | $360,288 | $81,375 | $278,913 |
| 2018 | $4,765 | $351,265 | $58,590 | $292,675 |
| 2017 | $4,730 | $351,265 | $58,590 | $292,675 |
| 2016 | $4,570 | $343,036 | $58,590 | $284,446 |
| 2015 | $5,183 | $374,379 | $71,400 | $302,979 |
| 2014 | $5,183 | $374,379 | $71,400 | $302,979 |
Source: Public Records
Map
Nearby Homes
- 1215 Bellenden Dr
- 519 Hunting Chase
- 7502 Hedfield Way
- 1039 Bellenden Dr
- 1040 Bellenden Dr
- 1604 Timber Wolf Dr
- 8115 Massey Chapel Rd
- 233 S Bend Dr
- 9 Coach Terrace
- 7516 Massey Chapel Rd
- 304 Marist Ct
- 120 James Ross Drive Rd
- 316 Academia Ct
- 203 S Bend Dr
- 1118 Scholastic Cir
- 204 S Bend Dr
- 903 Adeline Ct
- 107 Alumni Ave
- 1416 Southpoint Trail
- 1217 Great Egret Way
- 1212 Caribou Crossing
- 1218 Caribou Crossing
- 1213 Caribou Crossing
- 1215 Caribou Crossing
- 1211 Caribou Crossing
- 1208 Caribou Crossing
- 1014 Bellenden Dr
- 1220 Caribou Crossing
- 1217 Caribou Crossing
- 1016 Bellenden Dr
- 1012 Bellenden Dr
- 1209 Caribou Crossing
- 1206 Caribou Crossing
- 1018 Bellenden Dr
- 1222 Caribou Crossing
- 1219 Caribou Crossing
- 1207 Caribou Crossing
- 1010 Bellenden Dr
- 1020 Bellenden Dr
- 1207 Bellenden Dr