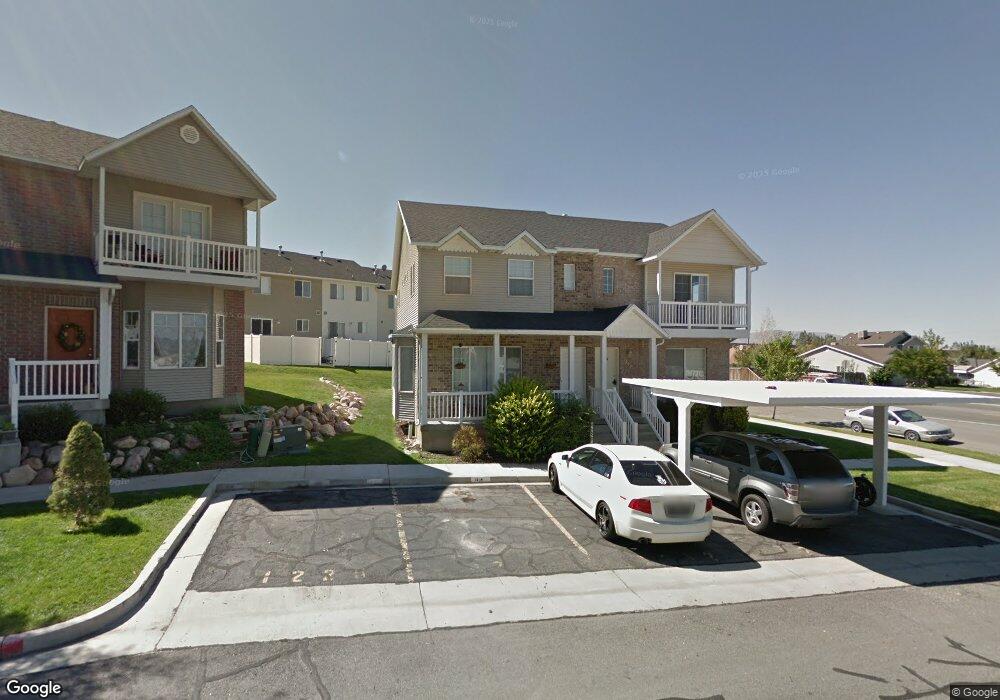
1214 E 680 N Spanish Fork, UT 84660
Estimated Value: $324,379 - $341,000
3
Beds
3
Baths
1,369
Sq Ft
$244/Sq Ft
Est. Value
About This Home
This home is located at 1214 E 680 N, Spanish Fork, UT 84660 and is currently estimated at $334,460, approximately $244 per square foot. 1214 E 680 N is a home located in Utah County with nearby schools including Rees Elementary School, Mapleton Junior High School, and Maple Mountain High School.
Ownership History
Date
Name
Owned For
Owner Type
Purchase Details
Closed on
Dec 19, 2002
Sold by
Simpkins Sundie and Simkins Sundie
Bought by
Simkins Sundie
Current Estimated Value
Home Financials for this Owner
Home Financials are based on the most recent Mortgage that was taken out on this home.
Original Mortgage
$119,932
Outstanding Balance
$47,387
Interest Rate
5.13%
Mortgage Type
FHA
Estimated Equity
$287,073
Purchase Details
Closed on
Aug 7, 2001
Sold by
Prestige Properties Inc
Bought by
Simpkins Sundie
Home Financials for this Owner
Home Financials are based on the most recent Mortgage that was taken out on this home.
Original Mortgage
$121,099
Interest Rate
7.1%
Mortgage Type
FHA
Create a Home Valuation Report for This Property
The Home Valuation Report is an in-depth analysis detailing your home's value as well as a comparison with similar homes in the area
Home Values in the Area
Average Home Value in this Area
Purchase History
| Date | Buyer | Sale Price | Title Company |
|---|---|---|---|
| Simkins Sundie | -- | Inwest Title Services Inc | |
| Simpkins Sundie | -- | Inwest Title Services Inc |
Source: Public Records
Mortgage History
| Date | Status | Borrower | Loan Amount |
|---|---|---|---|
| Open | Simkins Sundie | $119,932 | |
| Closed | Simpkins Sundie | $121,099 |
Source: Public Records
Tax History
| Year | Tax Paid | Tax Assessment Tax Assessment Total Assessment is a certain percentage of the fair market value that is determined by local assessors to be the total taxable value of land and additions on the property. | Land | Improvement |
|---|---|---|---|---|
| 2025 | $1,732 | $176,110 | -- | -- |
| 2024 | $1,732 | $178,530 | $0 | $0 |
| 2023 | $1,624 | $167,530 | $0 | $0 |
| 2022 | $1,680 | $170,060 | $0 | $0 |
| 2021 | $1,436 | $232,500 | $34,900 | $197,600 |
| 2020 | $1,347 | $212,000 | $31,800 | $180,200 |
| 2019 | $1,165 | $193,000 | $25,000 | $168,000 |
| 2018 | $1,049 | $167,900 | $21,000 | $146,900 |
| 2017 | $933 | $80,300 | $0 | $0 |
| 2016 | $894 | $75,900 | $0 | $0 |
| 2015 | $813 | $68,200 | $0 | $0 |
| 2014 | $745 | $62,700 | $0 | $0 |
Source: Public Records
Map
Nearby Homes
- 1238 E 680 N
- 1261 E 680 N
- 686 N Black Horse Loop
- 708 N Black Horse Loop Unit 708
- 1074 E 660 N
- 453 N 1210 E
- 755 Black Horse Dr
- 1050 E 800 N Unit 1
- 1050 E 800 N Unit 5
- 1025 E 360 N Unit 5
- 1022 E 360 N Unit 27
- 991 E 360 N Unit 8
- 822 N 1120 E
- 1495 E 400 N
- 902 N 1120 E
- 314 N 1070 E
- 998 E 260 N Unit 16
- 992 E 260 N Unit 15
- 284 N 1000 E
- 1005 E 260 N Unit 20
Your Personal Tour Guide
Ask me questions while you tour the home.