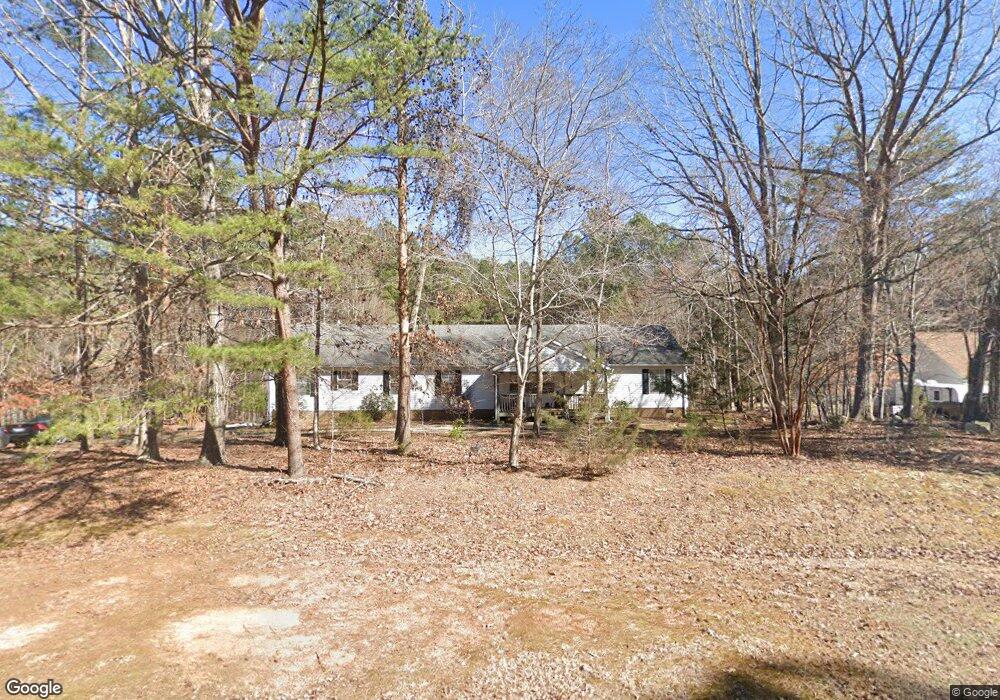
1214 Elysian Way Rougemont, NC 27572
Estimated Value: $347,000 - $418,000
3
Beds
2
Baths
2,052
Sq Ft
$190/Sq Ft
Est. Value
About This Home
This home is located at 1214 Elysian Way, Rougemont, NC 27572 and is currently estimated at $390,072, approximately $190 per square foot. 1214 Elysian Way is a home located in Durham County with nearby schools including Mangum Elementary School, Lucas Middle School, and Northern High School.
Ownership History
Date
Name
Owned For
Owner Type
Purchase Details
Closed on
Mar 4, 2004
Sold by
Chase Manhattan Mortgage Corp
Bought by
Ctx Mortgage Co
Current Estimated Value
Home Financials for this Owner
Home Financials are based on the most recent Mortgage that was taken out on this home.
Original Mortgage
$118,750
Outstanding Balance
$50,409
Interest Rate
4.37%
Mortgage Type
Unknown
Estimated Equity
$339,663
Purchase Details
Closed on
Mar 1, 2004
Sold by
Ctx Mortgage Co Llc
Bought by
Chapin Timothy C
Home Financials for this Owner
Home Financials are based on the most recent Mortgage that was taken out on this home.
Original Mortgage
$118,750
Outstanding Balance
$50,409
Interest Rate
4.37%
Mortgage Type
Unknown
Estimated Equity
$339,663
Purchase Details
Closed on
Oct 14, 2003
Sold by
Daniels Lydia D
Bought by
Chase Manhattan Mortgage Corp
Create a Home Valuation Report for This Property
The Home Valuation Report is an in-depth analysis detailing your home's value as well as a comparison with similar homes in the area
Home Values in the Area
Average Home Value in this Area
Purchase History
| Date | Buyer | Sale Price | Title Company |
|---|---|---|---|
| Ctx Mortgage Co | -- | -- | |
| Chapin Timothy C | $125,000 | -- | |
| Chase Manhattan Mortgage Corp | $120,466 | -- |
Source: Public Records
Mortgage History
| Date | Status | Borrower | Loan Amount |
|---|---|---|---|
| Open | Chapin Timothy C | $118,750 |
Source: Public Records
Tax History
| Year | Tax Paid | Tax Assessment Tax Assessment Total Assessment is a certain percentage of the fair market value that is determined by local assessors to be the total taxable value of land and additions on the property. | Land | Improvement |
|---|---|---|---|---|
| 2025 | $2,363 | $376,475 | $77,680 | $298,795 |
| 2024 | $2,046 | $224,947 | $39,882 | $185,065 |
| 2023 | $1,926 | $224,947 | $39,882 | $185,065 |
| 2022 | $1,838 | $224,947 | $39,882 | $185,065 |
| 2021 | $1,625 | $224,947 | $39,882 | $185,065 |
| 2020 | $1,602 | $224,947 | $39,882 | $185,065 |
| 2019 | $1,602 | $230,113 | $39,882 | $190,231 |
| 2018 | $1,478 | $189,958 | $37,330 | $152,628 |
| 2017 | $1,459 | $189,958 | $37,330 | $152,628 |
| 2016 | $1,406 | $189,958 | $37,330 | $152,628 |
| 2015 | $1,775 | $206,301 | $34,293 | $172,008 |
| 2014 | $1,775 | $206,301 | $34,293 | $172,008 |
Source: Public Records
Map
Nearby Homes
- 0 Weaver Ridge Rd Unit 10137151
- 129 Family Dr
- 919 Red Mountain Rd
- 18.2 Acres Range Rd
- 0 Thunder Rd Unit 10078281
- 1403 Moores Mill Rd
- 709 Lake Winds Trail
- 33 Fire Tower Dr
- 109 Equestrian Chase
- 2702 Red Valley Dr
- 13018 Meadow Ridge Dr
- 13013 Meadow Ridge Dr
- 1270 Moores Mill Rd
- 735 Harris Mill Rd
- 11907 N Roxboro St
- 13011 N Roxboro St
- 4209 Hall Rd
- 205 Bacon Rd
- 220 Bill Poole Rd
- 0 Owens Daye Rd
- 1212 Elysian Way
- 1216 Elysian Way
- 1213 Elysian Way
- 1208 Elysian Way
- 1215 Elysian Way
- 1218 Elysian Way
- 1217 Elysian Way
- 1204 Elysian Way
- 1208 Halcyon Place
- 1203 Elysian Way
- 1204 Halcyon Place
- 1221 Elysian Way
- 1210 Halcyon Place
- 1222 Elysian Way
- 1212 Halcyon Place
- 1225 Elysian Way Unit 29
- 1225 Elysian Way
- 1216 Halcyon Place
- 2 Orion Cir
- 4 Orion Cir
Your Personal Tour Guide
Ask me questions while you tour the home.