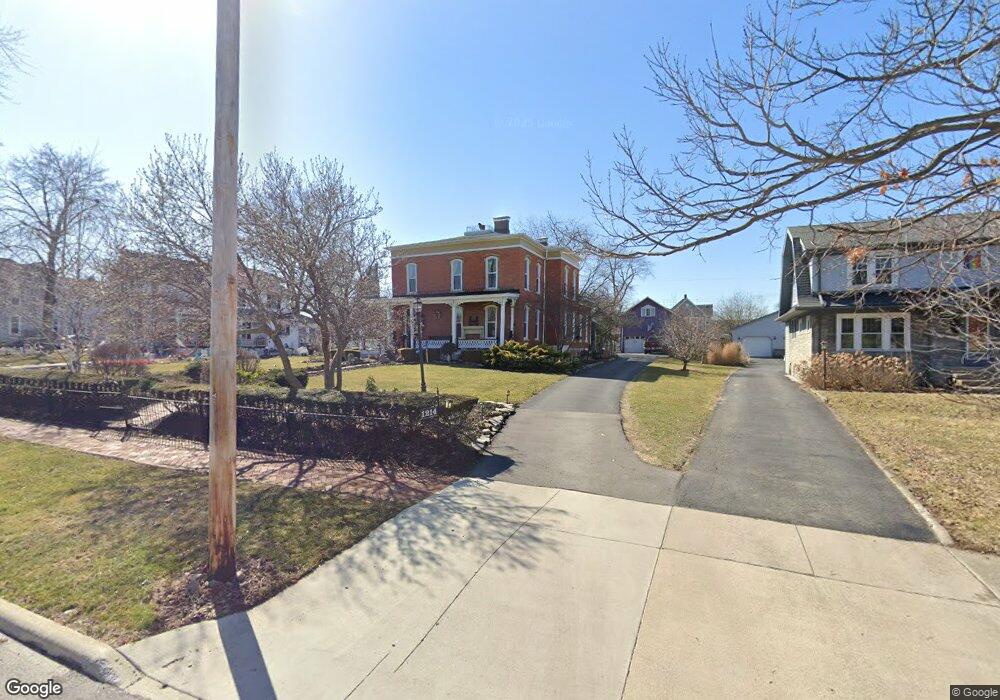
1214 Hurd Ave Findlay, OH 45840
Estimated Value: $267,000 - $378,000
4
Beds
3
Baths
2,712
Sq Ft
$124/Sq Ft
Est. Value
About This Home
This home is located at 1214 Hurd Ave, Findlay, OH 45840 and is currently estimated at $336,530, approximately $124 per square foot. 1214 Hurd Ave is a home located in Hancock County with nearby schools including Jefferson Elementary School, Chamberlin Hill Elementary School, and Donnell Middle School.
Ownership History
Date
Name
Owned For
Owner Type
Purchase Details
Closed on
Jun 13, 2013
Sold by
Anthony Rebecca
Bought by
Hopkins Richard A and Hopkins Robin C
Current Estimated Value
Home Financials for this Owner
Home Financials are based on the most recent Mortgage that was taken out on this home.
Original Mortgage
$260,184
Outstanding Balance
$183,088
Interest Rate
3.25%
Mortgage Type
FHA
Estimated Equity
$153,442
Purchase Details
Closed on
Jul 29, 1991
Bought by
Anthony Bruce E and Anthony Rebecca
Create a Home Valuation Report for This Property
The Home Valuation Report is an in-depth analysis detailing your home's value as well as a comparison with similar homes in the area
Home Values in the Area
Average Home Value in this Area
Purchase History
| Date | Buyer | Sale Price | Title Company |
|---|---|---|---|
| Hopkins Richard A | $269,900 | Mid Am Title Agency | |
| Anthony Bruce E | $129,900 | -- |
Source: Public Records
Mortgage History
| Date | Status | Borrower | Loan Amount |
|---|---|---|---|
| Open | Hopkins Richard A | $260,184 |
Source: Public Records
Tax History Compared to Growth
Tax History
| Year | Tax Paid | Tax Assessment Tax Assessment Total Assessment is a certain percentage of the fair market value that is determined by local assessors to be the total taxable value of land and additions on the property. | Land | Improvement |
|---|---|---|---|---|
| 2024 | $3,506 | $98,660 | $15,740 | $82,920 |
| 2023 | $3,511 | $98,660 | $15,740 | $82,920 |
| 2022 | $3,499 | $98,660 | $15,740 | $82,920 |
| 2021 | $3,462 | $85,030 | $16,120 | $68,910 |
| 2020 | $3,462 | $85,030 | $16,120 | $68,910 |
| 2019 | $3,392 | $85,030 | $16,120 | $68,910 |
| 2018 | $3,154 | $72,500 | $11,360 | $61,140 |
| 2017 | $1,577 | $72,500 | $11,360 | $61,140 |
| 2016 | $3,102 | $72,500 | $11,360 | $61,140 |
| 2015 | $2,960 | $67,650 | $11,360 | $56,290 |
| 2014 | $2,960 | $67,650 | $11,360 | $56,290 |
| 2012 | $2,154 | $48,840 | $10,720 | $38,120 |
Source: Public Records
Map
Nearby Homes