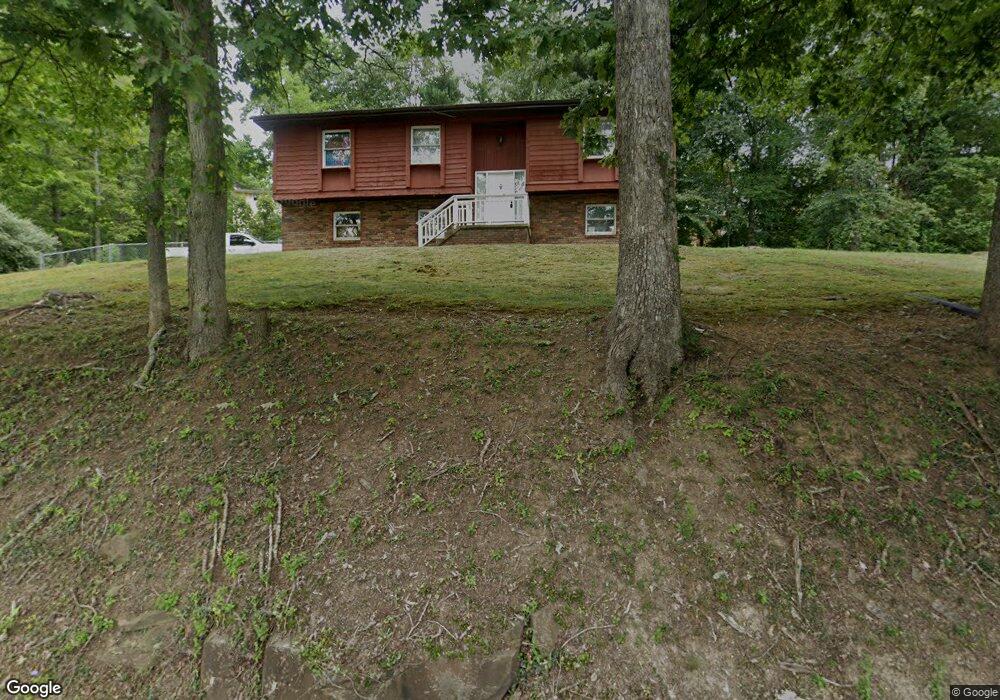
1214 N Poplar Fork Rd Hurricane, WV 25526
Estimated Value: $175,000 - $272,422
3
Beds
3
Baths
1,786
Sq Ft
$125/Sq Ft
Est. Value
About This Home
This home is located at 1214 N Poplar Fork Rd, Hurricane, WV 25526 and is currently estimated at $223,356, approximately $125 per square foot. 1214 N Poplar Fork Rd is a home located in Putnam County with nearby schools including Teays Valley Christian School and Calvary Baptist Academy.
Ownership History
Date
Name
Owned For
Owner Type
Purchase Details
Closed on
Jul 31, 2024
Sold by
Wiley William C and Wiley Leanndra Paige
Bought by
Fuller Kevin and Meenan Kathleen
Current Estimated Value
Home Financials for this Owner
Home Financials are based on the most recent Mortgage that was taken out on this home.
Original Mortgage
$195,395
Outstanding Balance
$193,043
Interest Rate
6.95%
Mortgage Type
FHA
Estimated Equity
$30,313
Purchase Details
Closed on
Sep 10, 2021
Sold by
Moon Anna M
Bought by
Wiley William C and Wiley Leanndra Paige
Home Financials for this Owner
Home Financials are based on the most recent Mortgage that was taken out on this home.
Original Mortgage
$178,850
Interest Rate
2.8%
Mortgage Type
VA
Purchase Details
Closed on
Mar 8, 2012
Sold by
Moon Thomas P
Bought by
Moon Anna M
Purchase Details
Closed on
Jun 27, 2006
Sold by
Freed Steven D and Freed Tandra F
Bought by
Moon Thomas P and Moon Anna M
Create a Home Valuation Report for This Property
The Home Valuation Report is an in-depth analysis detailing your home's value as well as a comparison with similar homes in the area
Home Values in the Area
Average Home Value in this Area
Purchase History
| Date | Buyer | Sale Price | Title Company |
|---|---|---|---|
| Fuller Kevin | $199,000 | None Listed On Document | |
| Wiley William C | $175,000 | None Available | |
| Moon Anna M | -- | -- | |
| Moon Thomas P | $113,000 | -- |
Source: Public Records
Mortgage History
| Date | Status | Borrower | Loan Amount |
|---|---|---|---|
| Open | Fuller Kevin | $195,395 | |
| Previous Owner | Wiley William C | $178,850 |
Source: Public Records
Tax History Compared to Growth
Tax History
| Year | Tax Paid | Tax Assessment Tax Assessment Total Assessment is a certain percentage of the fair market value that is determined by local assessors to be the total taxable value of land and additions on the property. | Land | Improvement |
|---|---|---|---|---|
| 2024 | $1,199 | $89,640 | $22,740 | $66,900 |
| 2023 | $1,010 | $86,520 | $22,740 | $63,780 |
| 2022 | $1,034 | $85,740 | $22,740 | $63,000 |
| 2021 | $1,012 | $83,580 | $22,740 | $60,840 |
| 2020 | $996 | $82,320 | $22,140 | $60,180 |
| 2019 | $959 | $78,120 | $22,140 | $55,980 |
| 2018 | $957 | $77,700 | $22,140 | $55,560 |
| 2017 | $873 | $71,520 | $17,520 | $54,000 |
| 2016 | $856 | $68,580 | $17,520 | $51,060 |
| 2015 | $858 | $68,220 | $17,520 | $50,700 |
| 2014 | $795 | $63,240 | $17,520 | $45,720 |
Source: Public Records
Map
Nearby Homes
- 20 Poplar Hills
- 49 Timber Turn Ln
- 41 Poplar Hills
- 2 Deer Run
- 148 Glenwood Ln
- 107 Gladewood Ln
- 10 Cordoba Dr
- 283 Mize Rd
- 3005 Mount Vernon Rd
- 0 Station Place Way
- 701 Tower Rd
- 8016 Southridge Way
- 8018 Southridge Way
- 9000-9001 Claymont Cir
- 3 Charlo Acres - Sable Point Dr
- 201 Weatheridge Dr
- 8004 Southridge Way
- 37 Cedar Dr
- 20 Carriage Way
- 16 Chemar Dr
- 1214 N Poplar Fork Rd
- 1234 N Poplar Fork Rd
- 414 N Poplar Fork Rd
- 117 Raintree Dr
- 1188 N Poplar Fork Rd
- 115 Raintree Dr
- 416 Poplar Fork Rd
- 113 Raintree Dr
- 417 Poplar Fork Rd
- 111 Raintree Dr
- 418 Poplar Fork Rd
- 418 N Poplar Fork Rd
- 116 Raintree Dr
- 120 Raintree Dr
- 123 Raintree Dr
- 1146 N Poplar Fork Rd
- 1 Richland Dr
- 112 Raintree Dr
- 118 Raintree Dr
- 118 Raintree Dr