1214 S 12th St Unit $3,000 CASH TO BUYER Nederland, TX 77627
Estimated Value: $214,000 - $290,000
3
Beds
3
Baths
2,211
Sq Ft
$110/Sq Ft
Est. Value
About This Home
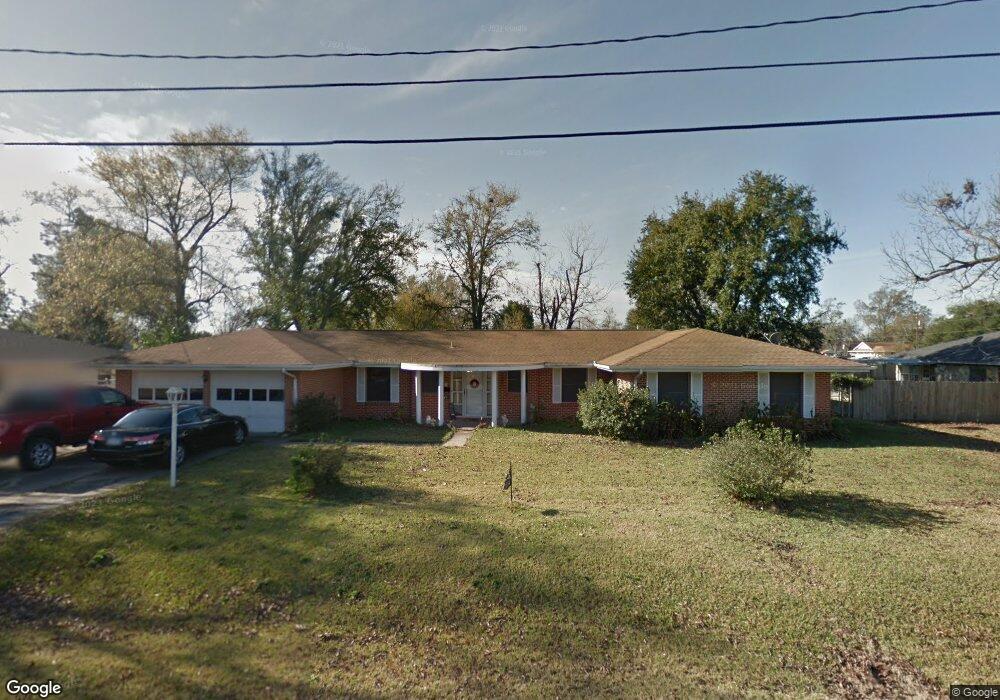
This home is located at 1214 S 12th St Unit $3,000 CASH TO BUYER, Nederland, TX 77627 and is currently estimated at $242,706, approximately $109 per square foot. 1214 S 12th St Unit $3,000 CASH TO BUYER is a home located in Jefferson County with nearby schools including Nederland High School.
Ownership History
Date
Name
Owned For
Owner Type
Purchase Details
Closed on
Mar 23, 2015
Sold by
Drake Tanna R
Bought by
Phorat Development Llc
Current Estimated Value
Purchase Details
Closed on
Sep 25, 2014
Sold by
Mccauley Daniel O Brien
Bought by
Drake Tanna R
Purchase Details
Closed on
Oct 28, 2011
Sold by
Houseman Gisela
Bought by
Odom Ingham Sheila
Home Financials for this Owner
Home Financials are based on the most recent Mortgage that was taken out on this home.
Original Mortgage
$136,900
Interest Rate
4.13%
Mortgage Type
Seller Take Back
Purchase Details
Closed on
Jan 12, 2011
Sold by
Grimes Yvonne M
Bought by
Mccauley Daniel O and Drake Tanna R
Home Financials for this Owner
Home Financials are based on the most recent Mortgage that was taken out on this home.
Original Mortgage
$123,292
Interest Rate
4.56%
Mortgage Type
FHA
Create a Home Valuation Report for This Property
The Home Valuation Report is an in-depth analysis detailing your home's value as well as a comparison with similar homes in the area
Home Values in the Area
Average Home Value in this Area
Purchase History
| Date | Buyer | Sale Price | Title Company |
|---|---|---|---|
| Phorat Development Llc | -- | Stewart Title | |
| Drake Tanna R | -- | Stewart Title | |
| Odom Ingham Sheila | -- | None Available | |
| Mccauley Daniel O | -- | None Available |
Source: Public Records
Mortgage History
| Date | Status | Borrower | Loan Amount |
|---|---|---|---|
| Previous Owner | Odom Ingham Sheila | $136,900 | |
| Previous Owner | Mccauley Daniel O | $123,292 | |
| Closed | Drake Tanna R | $0 |
Source: Public Records
Tax History Compared to Growth
Tax History
| Year | Tax Paid | Tax Assessment Tax Assessment Total Assessment is a certain percentage of the fair market value that is determined by local assessors to be the total taxable value of land and additions on the property. | Land | Improvement |
|---|---|---|---|---|
| 2025 | $4,098 | $208,220 | $50,666 | $157,554 |
| 2024 | $4,098 | $191,824 | $50,666 | $141,158 |
| 2023 | $4,098 | $179,972 | $32,340 | $147,632 |
| 2022 | $4,254 | $179,972 | $32,340 | $147,632 |
| 2021 | $4,432 | $170,129 | $32,340 | $137,789 |
| 2020 | $3,993 | $161,774 | $32,340 | $129,434 |
| 2019 | $3,636 | $148,010 | $32,340 | $115,670 |
| 2018 | $3,433 | $139,750 | $32,340 | $107,410 |
| 2017 | $3,177 | $131,480 | $32,340 | $99,140 |
| 2016 | $3,020 | $127,350 | $32,340 | $95,010 |
| 2015 | $2,480 | $120,880 | $25,870 | $95,010 |
| 2014 | $2,480 | $118,530 | $23,520 | $95,010 |
Source: Public Records
Map
Nearby Homes
- 1214 S 12th St
- 1220 S 12th St
- 1203 Avenue K
- 1220 S 12th St
- 1215 S 13th St
- 1207 S 13th St
- 1219 S 13th St
- 1203 S 13th St
- 1215 S 12th St
- 1223 S 13th St
- 1207 S 12th St
- 1124 Avenue L
- 1208 Avenue K
- 1159 Avenue K
- 1304 S 12th St
- 1304 S 12th St
- 1120 S 12th St
- 1305 S 13th St
- 1305 S 12th St
- 1220 S Twin City Hwy