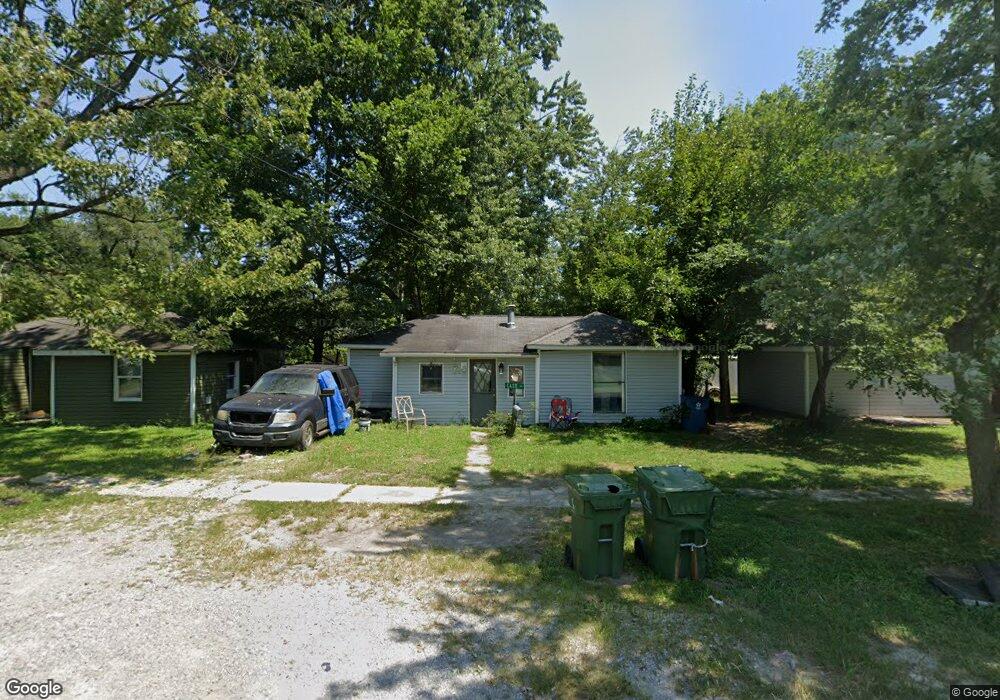
1214 S 27th St Mount Vernon, IL 62864
Estimated Value: $48,131 - $64,000
1
Bed
1
Bath
650
Sq Ft
$87/Sq Ft
Est. Value
About This Home
This home is located at 1214 S 27th St, Mount Vernon, IL 62864 and is currently estimated at $56,783, approximately $87 per square foot. 1214 S 27th St is a home located in Jefferson County with nearby schools including J.L. Buford Intermediate Education Center, Osborne Primary Center, and Zadok Casey Middle School.
Ownership History
Date
Name
Owned For
Owner Type
Purchase Details
Closed on
May 19, 2025
Sold by
Fowler Katie
Bought by
Fowler Jacob and Fowler Kandie
Current Estimated Value
Purchase Details
Closed on
Apr 11, 2024
Sold by
Gawinski Gerald
Bought by
Fowler Allen and Fowler Katie
Purchase Details
Closed on
Apr 4, 2022
Sold by
Gawinski Gerald
Bought by
Fowler Allen
Purchase Details
Closed on
Nov 5, 2018
Sold by
Chicago T Co Na Tr
Bought by
Gawinski Gerald
Purchase Details
Closed on
Sep 21, 2018
Sold by
Gawinski Gerald
Bought by
Chicago T Co Na
Purchase Details
Closed on
Aug 6, 2018
Sold by
Harvey Becky
Bought by
Gawinski Gerald
Purchase Details
Closed on
May 25, 2018
Sold by
Mcchesney Somer
Bought by
Becky-Hardey Gerald G
Purchase Details
Closed on
Nov 30, 2017
Sold by
Gulley Don
Bought by
Mcchesney Somer
Purchase Details
Closed on
Aug 4, 2011
Sold by
Gulley Don
Bought by
Lowry Somer
Create a Home Valuation Report for This Property
The Home Valuation Report is an in-depth analysis detailing your home's value as well as a comparison with similar homes in the area
Home Values in the Area
Average Home Value in this Area
Purchase History
| Date | Buyer | Sale Price | Title Company |
|---|---|---|---|
| Fowler Jacob | -- | None Listed On Document | |
| Fowler Allen | $9,000 | None Listed On Document | |
| Fowler Allen | $8,560 | -- | |
| Gawinski Gerald | -- | -- | |
| Chicago T Co Na | -- | -- | |
| Gawinski Gerald | -- | -- | |
| Becky-Hardey Gerald G | $1,300 | -- | |
| Mcchesney Somer | $8,500 | -- | |
| Lowry Somer | $8,500 | None Available |
Source: Public Records
Mortgage History
| Date | Status | Borrower | Loan Amount |
|---|---|---|---|
| Closed | Fowler Allen | -- |
Source: Public Records
Tax History Compared to Growth
Tax History
| Year | Tax Paid | Tax Assessment Tax Assessment Total Assessment is a certain percentage of the fair market value that is determined by local assessors to be the total taxable value of land and additions on the property. | Land | Improvement |
|---|---|---|---|---|
| 2024 | $722 | $8,318 | $1,341 | $6,977 |
| 2023 | $672 | $7,679 | $1,238 | $6,441 |
| 2022 | $572 | $5,913 | $1,086 | $4,827 |
| 2021 | $170 | $5,631 | $1,034 | $4,597 |
| 2020 | $174 | $5,262 | $966 | $4,296 |
| 2019 | $171 | $5,262 | $966 | $4,296 |
| 2018 | $108 | $1,060 | $966 | $94 |
| 2017 | $167 | $5,858 | $966 | $4,892 |
| 2016 | $167 | $5,858 | $966 | $4,892 |
| 2015 | $164 | $5,858 | $966 | $4,892 |
| 2014 | $458 | $5,858 | $966 | $4,892 |
| 2013 | $458 | $5,526 | $911 | $4,615 |
Source: Public Records
Map
Nearby Homes
- 2603 Veterans Memorial Dr
- 2508 Forest Ave
- 1103 S 24th St
- 3128 Veterans Memorial Dr
- 1011 Blueberry Hill Ave
- 2905 Jamison Blvd
- 3112 Lime Ave
- 11530 N 28th St
- 806 S 22nd St
- 704 S 24th St
- 817 S 20th St
- 820 S 20th St
- 601 Nora Ln
- 608 S 23rd St
- 3221 Peach St
- 1418 Wescott St
- 2814 Mannen St
- 2809 Cherry St
- 1511 Triangle St
- 629 S 18th St