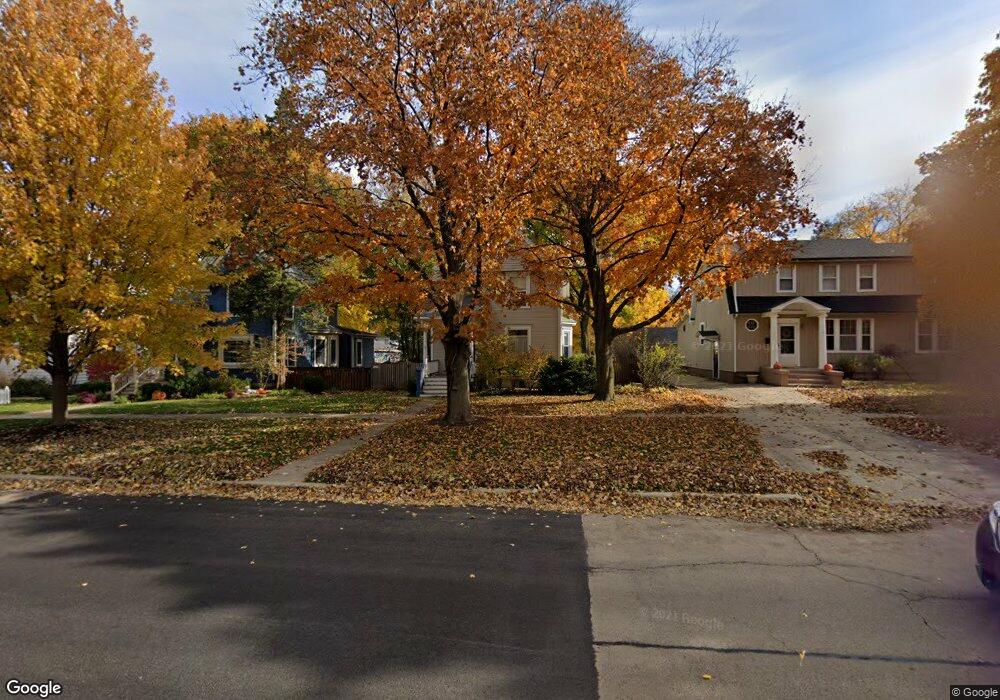
1214 S 3rd St Saint Charles, IL 60174
Southwest Saint Charles NeighborhoodEstimated Value: $388,687 - $420,000
3
Beds
2
Baths
1,457
Sq Ft
$281/Sq Ft
Est. Value
About This Home
This home is located at 1214 S 3rd St, Saint Charles, IL 60174 and is currently estimated at $409,922, approximately $281 per square foot. 1214 S 3rd St is a home located in Kane County with nearby schools including Davis Primary School, Richmond Intermediate School, and Thompson Middle School.
Ownership History
Date
Name
Owned For
Owner Type
Purchase Details
Closed on
Sep 29, 2006
Sold by
Powell Jennifer C and Halcomb Darrin R
Bought by
Peavy Frank H and Peavy Donna J
Current Estimated Value
Purchase Details
Closed on
May 31, 2002
Sold by
Kingston Kevin J and Kingston Julie A
Bought by
Powell Jennifer C and Halcomb Darrin R
Home Financials for this Owner
Home Financials are based on the most recent Mortgage that was taken out on this home.
Original Mortgage
$172,400
Interest Rate
6.91%
Purchase Details
Closed on
Sep 25, 1996
Sold by
Doering Bernard P and Doering Kelley A
Bought by
Kingston Kevin J and Kingston Julie A
Purchase Details
Closed on
Aug 10, 1995
Sold by
Anderson Elsie G
Bought by
Doering Bernard P and Doering Kelley A
Home Financials for this Owner
Home Financials are based on the most recent Mortgage that was taken out on this home.
Original Mortgage
$95,600
Interest Rate
7%
Create a Home Valuation Report for This Property
The Home Valuation Report is an in-depth analysis detailing your home's value as well as a comparison with similar homes in the area
Home Values in the Area
Average Home Value in this Area
Purchase History
| Date | Buyer | Sale Price | Title Company |
|---|---|---|---|
| Peavy Frank H | $282,000 | Chicago Title Insurance Co | |
| Powell Jennifer C | $215,500 | -- | |
| Kingston Kevin J | $162,500 | Ticor Title Insurance | |
| Doering Bernard P | $119,500 | -- |
Source: Public Records
Mortgage History
| Date | Status | Borrower | Loan Amount |
|---|---|---|---|
| Previous Owner | Powell Jennifer C | $172,400 | |
| Previous Owner | Doering Bernard P | $95,600 | |
| Closed | Powell Jennifer C | $21,550 |
Source: Public Records
Tax History
| Year | Tax Paid | Tax Assessment Tax Assessment Total Assessment is a certain percentage of the fair market value that is determined by local assessors to be the total taxable value of land and additions on the property. | Land | Improvement |
|---|---|---|---|---|
| 2024 | $4,095 | $114,197 | $32,398 | $81,799 |
| 2023 | $4,415 | $102,208 | $28,997 | $73,211 |
| 2022 | $4,857 | $98,076 | $28,406 | $69,670 |
| 2021 | $4,907 | $93,486 | $27,077 | $66,409 |
| 2020 | $4,951 | $91,743 | $26,572 | $65,171 |
| 2019 | $4,965 | $89,927 | $26,046 | $63,881 |
| 2018 | $4,990 | $85,755 | $23,429 | $62,326 |
| 2017 | $5,041 | $82,823 | $22,628 | $60,195 |
| 2016 | $6,296 | $79,914 | $21,833 | $58,081 |
| 2015 | -- | $75,271 | $21,598 | $53,673 |
| 2014 | -- | $71,160 | $21,598 | $49,562 |
| 2013 | -- | $72,031 | $21,814 | $50,217 |
Source: Public Records
Map
Nearby Homes
- 1219 Elm St
- 1326 Elm St
- 1334 S 5th St
- 1028 S 5th St
- 933 Elm St
- 46 White Oak Cir Unit 2
- 1008 Pine St
- 885 Geneva Rd
- 1001 Geneva Rd
- Lot 2 Geneva Rd
- Lot 1 Geneva Rd
- 31 Roosevelt St
- 640 Anderson Blvd
- 629 N Lincoln Ave
- 518 Illinois St
- 38 Bluestone Dr
- 2753 Stone Cir
- 2749 Stone Cir
- 2747 Stone Cir
- 2751 Stone Cir
Your Personal Tour Guide
Ask me questions while you tour the home.