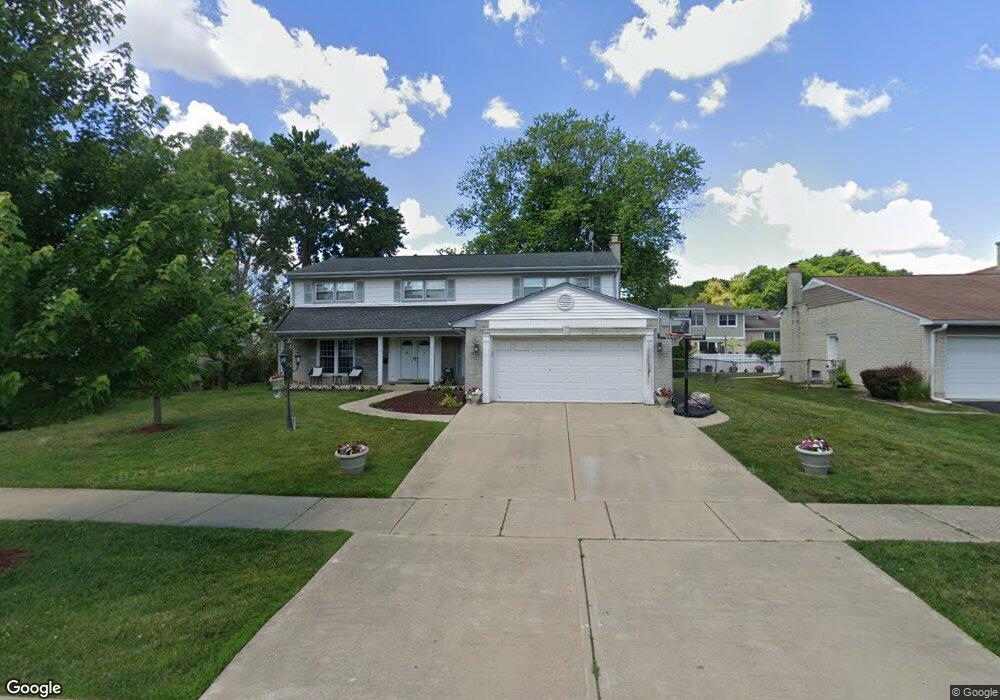
1214 S Ridge Ave Arlington Heights, IL 60005
Estimated Value: $637,677 - $731,000
5
Beds
3
Baths
2,805
Sq Ft
$248/Sq Ft
Est. Value
About This Home
This home is located at 1214 S Ridge Ave, Arlington Heights, IL 60005 and is currently estimated at $695,669, approximately $248 per square foot. 1214 S Ridge Ave is a home located in Cook County with nearby schools including Holmes Jr High School, Juliette Low Elementary School, and Rolling Meadows High School.
Ownership History
Date
Name
Owned For
Owner Type
Purchase Details
Closed on
Apr 11, 2012
Sold by
Eshaya David and Eshaya Diana
Bought by
Eshaya David and Eshaya Diana
Current Estimated Value
Home Financials for this Owner
Home Financials are based on the most recent Mortgage that was taken out on this home.
Original Mortgage
$389,898
Outstanding Balance
$269,180
Interest Rate
3.9%
Mortgage Type
FHA
Estimated Equity
$426,489
Purchase Details
Closed on
May 20, 2011
Sold by
Kritikos Harry and Kritikos Effie
Bought by
Eshaya David and Sweis Diana
Home Financials for this Owner
Home Financials are based on the most recent Mortgage that was taken out on this home.
Original Mortgage
$389,860
Interest Rate
4.75%
Mortgage Type
FHA
Purchase Details
Closed on
Mar 21, 1994
Sold by
Garner Sanders A and Garner Wendy L
Bought by
Kritikos Harry and Papoutsis Effie
Home Financials for this Owner
Home Financials are based on the most recent Mortgage that was taken out on this home.
Original Mortgage
$165,000
Interest Rate
7.17%
Create a Home Valuation Report for This Property
The Home Valuation Report is an in-depth analysis detailing your home's value as well as a comparison with similar homes in the area
Home Values in the Area
Average Home Value in this Area
Purchase History
| Date | Buyer | Sale Price | Title Company |
|---|---|---|---|
| Eshaya David | -- | Nations Title | |
| Eshaya David | $400,000 | Cti | |
| Kritikos Harry | $173,333 | -- |
Source: Public Records
Mortgage History
| Date | Status | Borrower | Loan Amount |
|---|---|---|---|
| Open | Eshaya David | $389,898 | |
| Closed | Eshaya David | $389,860 | |
| Previous Owner | Kritikos Harry | $165,000 |
Source: Public Records
Tax History Compared to Growth
Tax History
| Year | Tax Paid | Tax Assessment Tax Assessment Total Assessment is a certain percentage of the fair market value that is determined by local assessors to be the total taxable value of land and additions on the property. | Land | Improvement |
|---|---|---|---|---|
| 2024 | $10,276 | $43,040 | $8,791 | $34,249 |
| 2023 | $10,756 | $43,040 | $8,791 | $34,249 |
| 2022 | $10,756 | $47,000 | $8,791 | $38,209 |
| 2021 | $9,985 | $38,662 | $5,714 | $32,948 |
| 2020 | $9,762 | $38,662 | $5,714 | $32,948 |
| 2019 | $9,951 | $43,441 | $5,714 | $37,727 |
| 2018 | $9,594 | $37,738 | $4,835 | $32,903 |
| 2017 | $9,472 | $37,738 | $4,835 | $32,903 |
| 2016 | $9,089 | $37,738 | $4,835 | $32,903 |
| 2015 | $9,509 | $36,905 | $4,395 | $32,510 |
| 2014 | $9,401 | $36,905 | $4,395 | $32,510 |
| 2013 | $9,157 | $36,905 | $4,395 | $32,510 |
Source: Public Records
Map
Nearby Homes
- 1306 S Walnut Ave
- 1114 S Fernandez Ave
- 1025 S Fernandez Ave Unit 3M
- 1107 W White Oak St
- 1607 S Kaspar Ave
- 1355 S Dunton Ave
- 116 E Orchard St
- 1602 W Orchard Place Unit 1602C
- 751 S Dwyer Ave Unit F
- 1306 S New Wilke Rd Unit 2B
- 1210 S Douglas Ave
- 1322 S New Wilke Rd Unit 1C
- 1207 W Keating Dr
- 1206 S New Wilke Rd Unit 108
- 1207 S Old Wilke Rd Unit 303
- 1227 S Old Wilke Rd Unit 306
- 1860 W Surrey Park Ln Unit 1C
- 1217 S Old Wilke Rd Unit 11110
- 1217 S Old Wilke Rd Unit 11406
- 1107 S Old Wilke Rd Unit 201
- 1218 S Ridge Ave
- 1210 S Ridge Ave
- 1215 S Fernandez Ave
- 1219 S Fernandez Ave
- 1211 S Fernandez Ave
- 1222 S Ridge Ave
- 1206 S Ridge Ave
- 1249 S Ridge Ave
- 1243 S Ridge Ave
- 1237 S Ridge Ave
- 1255 S Ridge Ave
- 1223 S Fernandez Ave
- 1207 S Fernandez Ave
- 1231 S Ridge Ave
- 1261 S Ridge Ave
- 1225 S Ridge Ave
- 1267 S Ridge Ave
- 1202 S Ridge Ave
- 1226 S Ridge Ave
- 1219 S Ridge Ave