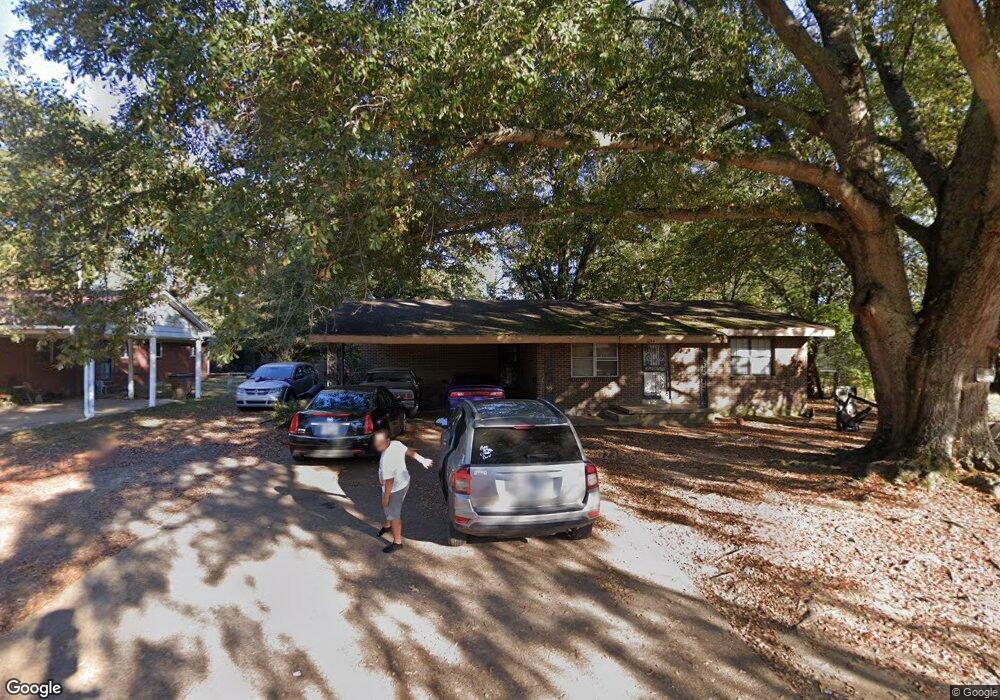
1214 Traylor St Forrest City, AR 72335
Estimated Value: $80,417 - $122,000
--
Bed
2
Baths
1,401
Sq Ft
$74/Sq Ft
Est. Value
About This Home
This home is located at 1214 Traylor St, Forrest City, AR 72335 and is currently estimated at $104,104, approximately $74 per square foot. 1214 Traylor St is a home located in St. Francis County with nearby schools including Central Elementary School, Stewart Elementary School, and Forrest City Junior High School.
Ownership History
Date
Name
Owned For
Owner Type
Purchase Details
Closed on
Aug 28, 2025
Sold by
Shirley Venus and Shirley L J
Bought by
Fertha-Stafford Sheryle
Current Estimated Value
Purchase Details
Closed on
Jul 24, 2025
Sold by
Commissioner Of State Lands
Bought by
Shirley J L
Purchase Details
Closed on
Mar 20, 2024
Sold by
Cross Davin
Bought by
Venus Shirley J and Venus Shirley
Purchase Details
Closed on
Mar 28, 2012
Sold by
Regions Bank
Bought by
Shirley J L
Purchase Details
Closed on
Feb 15, 2011
Bought by
Regions Bank
Purchase Details
Closed on
Jul 18, 2005
Sold by
Wall Christopher Eric and Wall Douglas George
Bought by
Dulaney Melvin
Home Financials for this Owner
Home Financials are based on the most recent Mortgage that was taken out on this home.
Original Mortgage
$71,000
Interest Rate
5.58%
Mortgage Type
New Conventional
Purchase Details
Closed on
May 1, 1989
Bought by
Trust-Vaska Brown Cope
Create a Home Valuation Report for This Property
The Home Valuation Report is an in-depth analysis detailing your home's value as well as a comparison with similar homes in the area
Home Values in the Area
Average Home Value in this Area
Purchase History
| Date | Buyer | Sale Price | Title Company |
|---|---|---|---|
| Fertha-Stafford Sheryle | $15,000 | None Listed On Document | |
| Shirley J L | $705 | None Listed On Document | |
| Venus Shirley J | -- | None Listed On Document | |
| Shirley J L | $39,000 | None Available | |
| Regions Bank | -- | -- | |
| Dulaney Melvin | $71,000 | None Available | |
| Trust-Vaska Brown Cope | -- | -- |
Source: Public Records
Mortgage History
| Date | Status | Borrower | Loan Amount |
|---|---|---|---|
| Previous Owner | Dulaney Melvin | $71,000 |
Source: Public Records
Tax History Compared to Growth
Tax History
| Year | Tax Paid | Tax Assessment Tax Assessment Total Assessment is a certain percentage of the fair market value that is determined by local assessors to be the total taxable value of land and additions on the property. | Land | Improvement |
|---|---|---|---|---|
| 2024 | $646 | $14,740 | $1,600 | $13,140 |
| 2023 | $567 | $14,740 | $1,600 | $13,140 |
| 2022 | $180 | $14,740 | $1,600 | $13,140 |
| 2021 | $161 | $11,550 | $1,600 | $9,950 |
| 2020 | $161 | $11,550 | $1,600 | $9,950 |
| 2019 | $173 | $11,550 | $1,600 | $9,950 |
| 2018 | $198 | $11,550 | $1,600 | $9,950 |
| 2017 | $535 | $11,550 | $1,600 | $9,950 |
| 2016 | $702 | $15,160 | $2,200 | $12,960 |
| 2015 | $702 | $15,160 | $2,200 | $12,960 |
| 2014 | $702 | $15,160 | $2,200 | $12,960 |
Source: Public Records
Map
Nearby Homes
- 1031 Cherry St
- 1047 N Rosser St
- 1047 N Rosser St Unit 122 E Arkansas Avenu
- 1110 N Division St
- 1006 Hickey St
- 947 Cherry St
- 319 Mississippi St
- 1216 N Izard St
- 1108 N Izard St
- 423 Laughrun Dr
- 717 Laughrun Dr
- 308 Trenton Rd
- 424 Beech Grove Dr
- 1030 N Izard St
- 220 Lexington Dr
- 1255 Chestnut St
- 361 Yorktown Dr
- 654 N Forrest St
- 617 N Forrest St
- 917 Calvert Cove
- 1222 Traylor St
- 226 Victoria St
- 218 Victoria St
- 1217 Farley St
- 212 Victoria Ave
- 212 Victoria St
- 1225 Farley St
- 217 Roosevelt Ave
- 225 Roosevelt Ave
- 204 Victoria Ave
- 1215 Traylor St
- 1221 Traylor St
- 204 Victoria St
- 211 Roosevelt Ave
- 1225 Traylor St
- 303 Roosevelt Ave
- 203 Roosevelt Ave
- 309 Roosevelt Ave
- 1216 Farley St
- 1212 Walsh St