R
Seller's Agent in 2013
Robert Sinclair
100% Real Estate, Inc
Estimated Value: $142,000 - $168,000
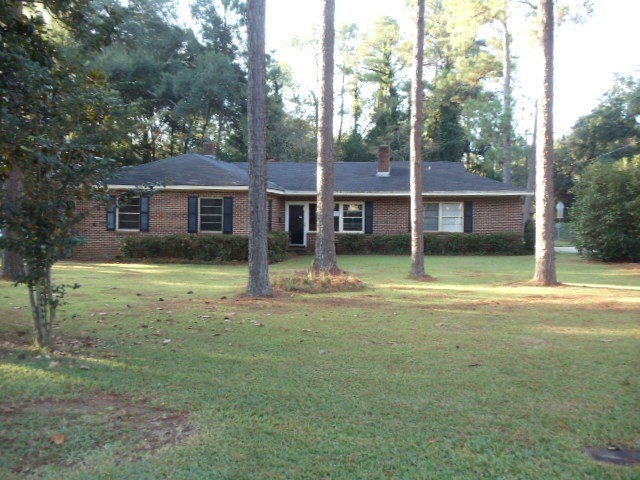
Terrific all original 3 bedroom 2 bath brick home in Palmyra heights. Built in 1948, offering 1,900+ sqft. Beautiful wood floors throughout, wood paneling and high ceilings. Warm and inviting living room has brick fireplace that would be great to cuddle up next to during the cold winters & built in shelving. Separate family room is located in the back of the house. Galley style kitchen w/updated countertops. Wonderful front and backyards w/mature pine trees for added privacy. If you appreciate originality, you will fall in love with this home! Just minutes from Third Avenue Shopping Center, Merry Acres Middle School and right off Hwy 19.
Last Agent to Sell the Property
Robert Sinclair
100% Real Estate, Inc Brokerage Phone: 8004543422 License #281045 Listed on: 11/18/2013
| Date | Buyer | Sale Price | Title Company |
|---|---|---|---|
| Johnson Darrick | -- | -- | |
| Department Of Housing & Urba | -- | -- | |
| Suntrust Mtg Inc | -- | -- | |
| Peterson Chas Jas | $131,750 | -- | |
| Scott Mary Katherine | -- | -- | |
| Scott Marion | $57,100 | -- |
| Date | Status | Borrower | Loan Amount |
|---|---|---|---|
| Closed | Johnson Darrick | $46,270 | |
| Previous Owner | Peterson Chas Jas | $129,666 |
| Date | Event | Price | List to Sale | Price per Sq Ft |
|---|---|---|---|---|
| 12/18/2013 12/18/13 | Sold | $64,000 | -- | $38 / Sq Ft |
| 11/18/2013 11/18/13 | Pending | -- | -- | -- |
| Year | Tax Paid | Tax Assessment Tax Assessment Total Assessment is a certain percentage of the fair market value that is determined by local assessors to be the total taxable value of land and additions on the property. | Land | Improvement |
|---|---|---|---|---|
| 2024 | $1,920 | $40,240 | $7,960 | $32,280 |
| 2023 | $1,875 | $40,240 | $7,960 | $32,280 |
| 2022 | $1,882 | $40,240 | $7,960 | $32,280 |
| 2021 | $1,745 | $40,240 | $7,960 | $32,280 |
| 2020 | $1,749 | $40,240 | $7,960 | $32,280 |
| 2019 | $1,733 | $39,720 | $7,960 | $31,760 |
| 2018 | $1,740 | $39,720 | $7,960 | $31,760 |
| 2017 | $1,621 | $39,720 | $7,960 | $31,760 |
| 2016 | $1,622 | $39,720 | $7,960 | $31,760 |
| 2015 | $1,626 | $39,720 | $7,960 | $31,760 |
| 2014 | $1,685 | $41,680 | $9,920 | $31,760 |
R
Seller's Agent in 2013
Robert Sinclair
100% Real Estate, Inc
P
Buyer's Agent in 2013
PHOEBE BUSH HATCHER
Trinity Real Estate Broker, Inc
(229) 347-5374
31 Total Sales
Source: Albany Board of REALTORS®
MLS Number: 130043
APN: 0000G-00038-012
