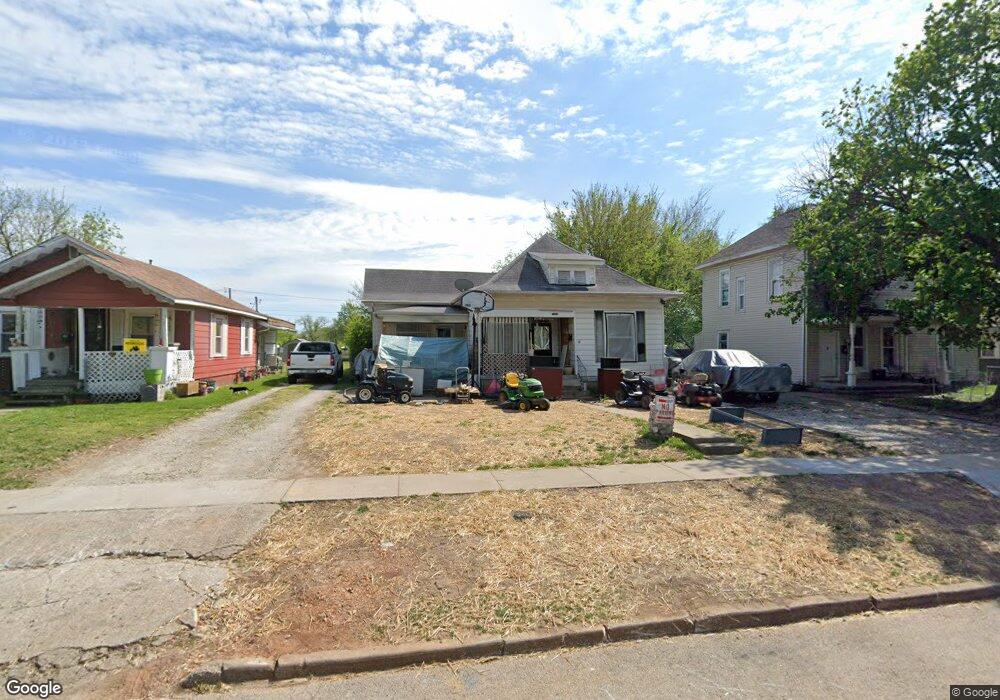
1214 W Chase St Springfield, MO 65803
Woodland Heights NeighborhoodEstimated Value: $112,969 - $127,000
2
Beds
1
Bath
880
Sq Ft
$134/Sq Ft
Est. Value
About This Home
This home is located at 1214 W Chase St, Springfield, MO 65803 and is currently estimated at $118,242, approximately $134 per square foot. 1214 W Chase St is a home located in Greene County with nearby schools including Bowerman Elementary School, Reed Academy, and Hillcrest High School.
Ownership History
Date
Name
Owned For
Owner Type
Purchase Details
Closed on
Apr 19, 2019
Sold by
Mid Misscuri Bank
Bought by
Clark Tami L and Clark Aundre M
Current Estimated Value
Home Financials for this Owner
Home Financials are based on the most recent Mortgage that was taken out on this home.
Original Mortgage
$27,284
Outstanding Balance
$24,036
Interest Rate
4.4%
Mortgage Type
Commercial
Estimated Equity
$94,206
Purchase Details
Closed on
Dec 27, 2010
Sold by
Us Bank National Association
Bought by
Gatley Chris
Purchase Details
Closed on
Jul 20, 2010
Sold by
Boesch Robert
Bought by
Us Bank Na
Purchase Details
Closed on
Nov 20, 2006
Sold by
Asbury Dorothy Madaline and Asbury Wanda Sue
Bought by
Boesch Robert
Home Financials for this Owner
Home Financials are based on the most recent Mortgage that was taken out on this home.
Original Mortgage
$50,730
Interest Rate
9.75%
Mortgage Type
Adjustable Rate Mortgage/ARM
Create a Home Valuation Report for This Property
The Home Valuation Report is an in-depth analysis detailing your home's value as well as a comparison with similar homes in the area
Home Values in the Area
Average Home Value in this Area
Purchase History
| Date | Buyer | Sale Price | Title Company |
|---|---|---|---|
| Clark Tami L | -- | None Available | |
| Gatley Chris | -- | None Available | |
| Us Bank Na | $28,475 | None Available | |
| Boesch Robert | -- | None Available |
Source: Public Records
Mortgage History
| Date | Status | Borrower | Loan Amount |
|---|---|---|---|
| Open | Clark Tami L | $27,284 | |
| Previous Owner | Boesch Robert | $50,730 |
Source: Public Records
Tax History
| Year | Tax Paid | Tax Assessment Tax Assessment Total Assessment is a certain percentage of the fair market value that is determined by local assessors to be the total taxable value of land and additions on the property. | Land | Improvement |
|---|---|---|---|---|
| 2025 | $508 | $10,200 | $3,800 | $6,400 |
| 2024 | $495 | $7,800 | $2,190 | $5,610 |
| 2023 | $522 | $7,800 | $2,190 | $5,610 |
| 2022 | $417 | $7,640 | $2,190 | $5,450 |
| 2021 | $417 | $7,640 | $2,190 | $5,450 |
| 2020 | $436 | $7,640 | $2,190 | $5,450 |
| 2019 | $424 | $7,640 | $2,190 | $5,450 |
| 2018 | $394 | $7,110 | $2,190 | $4,920 |
| 2017 | $390 | $7,110 | $2,190 | $4,920 |
| 2016 | $390 | $7,110 | $2,190 | $4,920 |
| 2015 | $386 | $7,110 | $2,190 | $4,920 |
| 2014 | $371 | $6,790 | $2,190 | $4,600 |
Source: Public Records
Map
Nearby Homes
- 1225 W Florida St
- 1121 W Florida St
- 1886 N Fort Ave
- 1026 W Commercial St
- 1042 W Commercial St
- 1056 W Commercial St
- 1330 W Atlantic St
- 1511 W Florida St
- 1105 W Division St
- 1110 W Division St
- 1026 W Division St
- 2036 N Johnston Ave
- 944 W Division St
- 1516 W Lee St
- 1885 N Douglas Ave
- 1447 N Broadway Ave
- 1450 N Broadway Ave
- 1139 W Lynn St
- 2111 N Newton Ave
- 2131 N Johnston Ave
- 1210 W Chase St
- 1220 W Chase St
- 1206 W Chase St
- 1226 W Chase St
- 1200 W Chase St
- 1230 W Chase St
- 1215 W Chase St
- 1221 W Chase St
- 2430 N Fort Ave
- Lots 63-68 N Fort Ave
- 1227 W Chase St
- 1207 W Chase St
- 1231 W Chase St
- 1201 W Chase St
- 1300 W Chase St
- 1128 W Chase St
- 1131 W Chase St
- 1122 W Chase St
- 1849 N Johnston Ave
- 1127 W Chase St
Your Personal Tour Guide
Ask me questions while you tour the home.