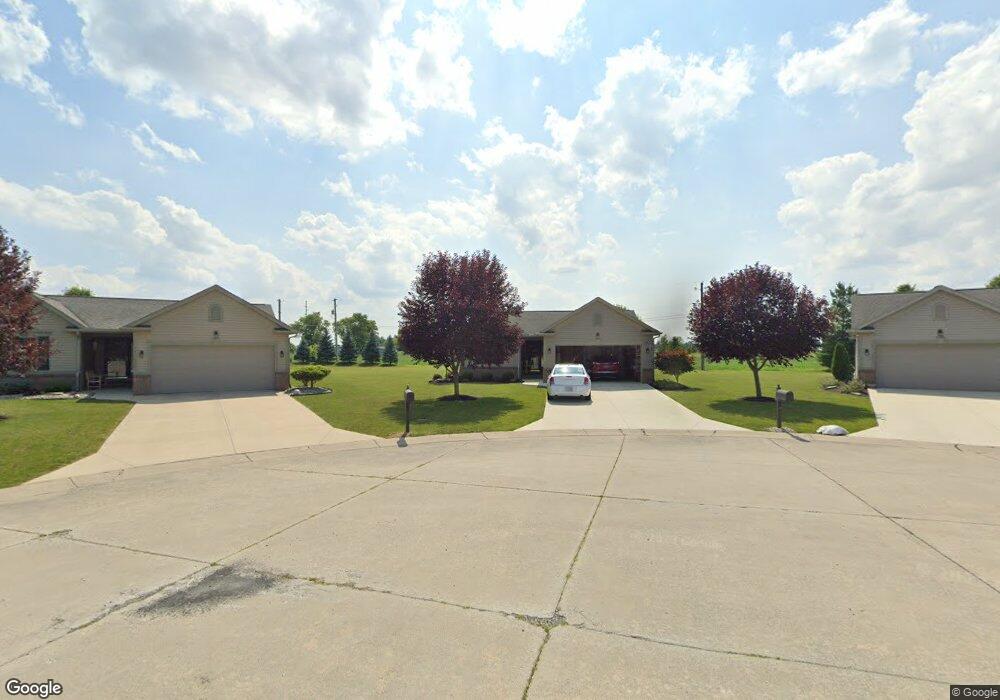
1214 William Ave Unit 1214 Delphos, OH 45833
Estimated Value: $177,040 - $275,000
2
Beds
2
Baths
1,254
Sq Ft
$175/Sq Ft
Est. Value
About This Home
This home is located at 1214 William Ave Unit 1214, Delphos, OH 45833 and is currently estimated at $220,010, approximately $175 per square foot. 1214 William Ave Unit 1214 is a home located in Van Wert County with nearby schools including Delphos St. John's High School and Delphos St. John's Elementary School.
Ownership History
Date
Name
Owned For
Owner Type
Purchase Details
Closed on
Feb 12, 2010
Sold by
Cartledge Cynthia Ann and Scarr Matthew J
Bought by
Jackson Joseph D and Jackson Susan A
Current Estimated Value
Purchase Details
Closed on
Nov 10, 2005
Sold by
Bba Builders Inc
Bought by
Scarr Pauline L
Home Financials for this Owner
Home Financials are based on the most recent Mortgage that was taken out on this home.
Original Mortgage
$89,791
Outstanding Balance
$48,430
Interest Rate
5.98%
Mortgage Type
Purchase Money Mortgage
Estimated Equity
$171,580
Purchase Details
Closed on
Feb 16, 2002
Bought by
Jackson Joseph D and Jackson Susan A
Create a Home Valuation Report for This Property
The Home Valuation Report is an in-depth analysis detailing your home's value as well as a comparison with similar homes in the area
Home Values in the Area
Average Home Value in this Area
Purchase History
| Date | Buyer | Sale Price | Title Company |
|---|---|---|---|
| Jackson Joseph D | $116,000 | Attorney | |
| Scarr Pauline L | $69,900 | None Available | |
| Jackson Joseph D | $116,000 | -- | |
| Jackson Joseph D | $116,000 | -- |
Source: Public Records
Mortgage History
| Date | Status | Borrower | Loan Amount |
|---|---|---|---|
| Open | Scarr Pauline L | $89,791 |
Source: Public Records
Tax History Compared to Growth
Tax History
| Year | Tax Paid | Tax Assessment Tax Assessment Total Assessment is a certain percentage of the fair market value that is determined by local assessors to be the total taxable value of land and additions on the property. | Land | Improvement |
|---|---|---|---|---|
| 2024 | $1,211 | $52,810 | $4,310 | $48,500 |
| 2023 | $1,211 | $52,810 | $4,310 | $48,500 |
| 2022 | $1,140 | $45,710 | $2,600 | $43,110 |
| 2021 | $1,143 | $45,710 | $2,600 | $43,110 |
| 2020 | $1,176 | $45,710 | $2,600 | $43,110 |
| 2019 | $869 | $39,080 | $2,600 | $36,480 |
| 2018 | $874 | $39,080 | $2,600 | $36,480 |
| 2017 | $876 | $39,080 | $2,600 | $36,480 |
| 2016 | $793 | $36,670 | $2,600 | $34,070 |
| 2015 | $793 | $36,670 | $2,600 | $34,070 |
| 2014 | $832 | $36,670 | $2,600 | $34,070 |
| 2013 | $1,165 | $36,670 | $2,600 | $34,070 |
Source: Public Records
Map
Nearby Homes
- 709 W 4th St
- 604 W 6th St
- 409 N Bredeick St
- 332 W 6th St
- 610 N Washington St
- 210 E 3rd St
- 405 N Franklin St
- 704 N Franklin St
- 221 S Main St
- 810 N Franklin St
- 424 S Canal St
- 634 S Clay St
- 483 S Franklin St
- 633 E 2nd St
- 827 S Washington St
- 521 Carolyn Dr
- 1303 Carolyn Dr
- 1400 S Clay St Unit 17
- 1220 Rose Anna Dr
- 8951 Brickner Rd
- 1210 William Ave
- 1215 William Ave Unit 1200
- 1219 William Ave
- 1204 William Ave Unit 1204
- 1200 William Ave Unit 1200
- 1125 William Ave
- 24249 Lincoln Hwy
- 1201 Vera Ave
- 600 William Ave
- 1231 Vera Ave
- 1102 William Ave
- 1105 William Ave
- 620 William Ave
- 507 Menke St
- 635 William Ave
- 629 Leonard Ave
- 24277 Lincoln Hwy