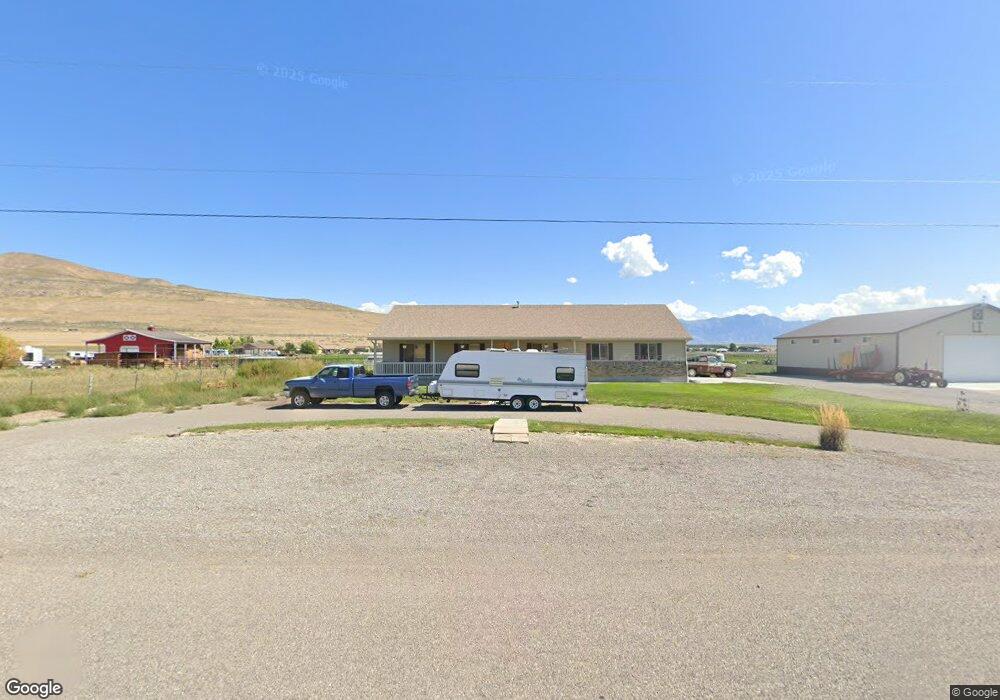
12144 N 10000 W Unit 4 Tremonton, UT 84337
Estimated Value: $477,000 - $727,603
--
Bed
--
Bath
1,769
Sq Ft
$330/Sq Ft
Est. Value
About This Home
This home is located at 12144 N 10000 W Unit 4, Tremonton, UT 84337 and is currently estimated at $583,901, approximately $330 per square foot. 12144 N 10000 W Unit 4 is a home located in Box Elder County with nearby schools including Garland School, Alice C. Harris Intermediate School, and Bear River Middle School.
Ownership History
Date
Name
Owned For
Owner Type
Purchase Details
Closed on
Jun 25, 2021
Sold by
Ivers Jeff H
Bought by
Ivers Jeffrey H and Ivers Lois C
Current Estimated Value
Purchase Details
Closed on
Apr 5, 2021
Sold by
Ivers Jeff H and Ivers Lois C
Bought by
Ivers Jeffrey H and Ivers Lois C
Purchase Details
Closed on
Dec 26, 2012
Sold by
Ivers Jeffrey H and Ivers Jeff H
Bought by
Ivers Jeff H and Ivers Lois C
Home Financials for this Owner
Home Financials are based on the most recent Mortgage that was taken out on this home.
Original Mortgage
$246,500
Outstanding Balance
$170,588
Interest Rate
3.27%
Mortgage Type
New Conventional
Estimated Equity
$413,313
Purchase Details
Closed on
Apr 7, 2005
Sold by
Stevenson Farms Inc
Bought by
Ivers Jeffrey H and Ivers Lois C
Create a Home Valuation Report for This Property
The Home Valuation Report is an in-depth analysis detailing your home's value as well as a comparison with similar homes in the area
Home Values in the Area
Average Home Value in this Area
Purchase History
| Date | Buyer | Sale Price | Title Company |
|---|---|---|---|
| Ivers Jeffrey H | -- | None Available | |
| Ivers Jeffrey H | -- | None Available | |
| Ivers Jeff H | -- | None Available | |
| Ivers Jeffrey H | -- | American Secure Title |
Source: Public Records
Mortgage History
| Date | Status | Borrower | Loan Amount |
|---|---|---|---|
| Open | Ivers Jeff H | $246,500 |
Source: Public Records
Tax History Compared to Growth
Tax History
| Year | Tax Paid | Tax Assessment Tax Assessment Total Assessment is a certain percentage of the fair market value that is determined by local assessors to be the total taxable value of land and additions on the property. | Land | Improvement |
|---|---|---|---|---|
| 2025 | $3,029 | $665,905 | $210,000 | $455,905 |
| 2024 | $3,029 | $609,046 | $200,000 | $409,046 |
| 2023 | $3,056 | $629,040 | $192,000 | $437,040 |
| 2022 | $2,911 | $318,168 | $70,400 | $247,768 |
| 2021 | $2,610 | $430,937 | $115,000 | $315,937 |
| 2020 | $2,434 | $430,937 | $115,000 | $315,937 |
| 2019 | $2,236 | $40,000 | $20,000 | $20,000 |
| 2018 | $2,185 | $198,167 | $72,250 | $125,917 |
| 2017 | $2,265 | $343,940 | $72,250 | $228,940 |
| 2016 | $2,179 | $192,171 | $72,250 | $119,921 |
| 2015 | $2,018 | $181,269 | $72,250 | $109,019 |
| 2014 | $2,018 | $176,078 | $72,250 | $103,828 |
| 2013 | -- | $166,639 | $52,250 | $114,389 |
Source: Public Records
Map
Nearby Homes
- 13464 N 10800 W Unit 4
- 10230 W 11200 N
- 12695 N 10800 W
- 13585 N 10000 W
- 3566 W 1000 N
- 10645 N 10800 W Unit 1
- 10205 W 10400 N
- 3101 W 1000 N
- 229 W 1470 S Unit 44
- 10959 N 8300 W
- 10973 N 8300 W Unit 24
- 11157 N 8300 W Unit 10
- 11148 N 8300 W Unit 11
- 8345 W 11050 N
- Xavier Plan at Beckams Edge
- Ravenstone Plan at Beckams Edge
- Stanton Plan at Beckams Edge
- Somerley Plan at Beckams Edge
- Kensington Plan at Beckams Edge
- Northfield Plan at Beckams Edge
- 12182 N 10000 W
- 12182 N 10000 W Unit 5
- 12230 N 10000 W
- 12068 N 10000 W Unit 2
- 12068 N 10000 W
- 12266 N 10000 W Unit 7
- 12266 N 10000 W
- 12024 N 10000 W Unit 1
- 12306 N 10000 W
- 12306 N 10000 W Unit 8
- 9830 W Point Lookout Dr Unit 11
- 10090 W 12000 N
- 9815 W Point Lookout Dr Unit 37
- 11980 N 10000 W
- 11980 N 10000 W
- 9765 W Point Lookout Dr Unit 36
- 9765 W Point Lookout Dr Unit 36
- 9765 Point Lookout Dr
- 9810 W Point Lookout Dr
- 9810 W Point Lookout Dr Unit 12