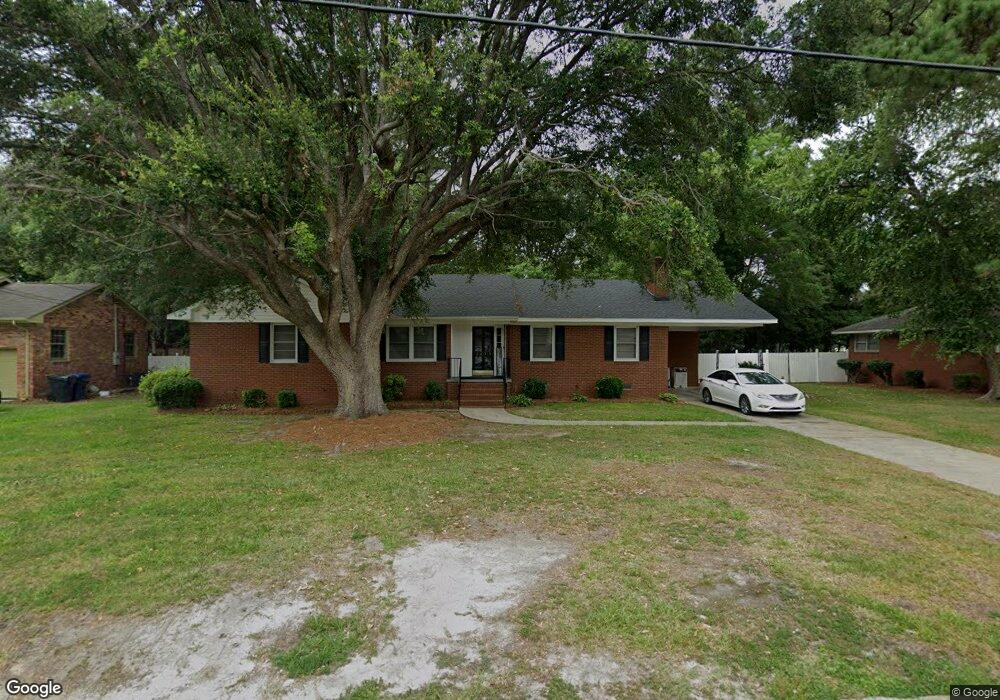
1215 Airlee Dr Unit 11 Kinston, NC 28504
Estimated Value: $195,035 - $219,000
4
Beds
2
Baths
1,692
Sq Ft
$123/Sq Ft
Est. Value
About This Home
This home is located at 1215 Airlee Dr Unit 11, Kinston, NC 28504 and is currently estimated at $208,259, approximately $123 per square foot. 1215 Airlee Dr Unit 11 is a home located in Lenoir County with nearby schools including Northwest Elementary School, Rochelle Middle School, and Kinston High School.
Ownership History
Date
Name
Owned For
Owner Type
Purchase Details
Closed on
May 23, 2022
Sold by
Suddreth Kathryn Caroline
Bought by
Kornegay Gregory D
Current Estimated Value
Home Financials for this Owner
Home Financials are based on the most recent Mortgage that was taken out on this home.
Original Mortgage
$165,938
Outstanding Balance
$157,279
Interest Rate
5%
Mortgage Type
FHA
Estimated Equity
$50,980
Purchase Details
Closed on
May 4, 2020
Sold by
Rbg Kinston Properties Llc
Bought by
Suddreth Kathryn Caroline
Home Financials for this Owner
Home Financials are based on the most recent Mortgage that was taken out on this home.
Original Mortgage
$113,000
Interest Rate
4.37%
Mortgage Type
New Conventional
Purchase Details
Closed on
Oct 19, 2017
Sold by
Goins Robert B
Bought by
Goins Helen E
Create a Home Valuation Report for This Property
The Home Valuation Report is an in-depth analysis detailing your home's value as well as a comparison with similar homes in the area
Home Values in the Area
Average Home Value in this Area
Purchase History
| Date | Buyer | Sale Price | Title Company |
|---|---|---|---|
| Kornegay Gregory D | $169,000 | None Listed On Document | |
| Suddreth Kathryn Caroline | $113,000 | None Available | |
| Goins Helen E | -- | None Available |
Source: Public Records
Mortgage History
| Date | Status | Borrower | Loan Amount |
|---|---|---|---|
| Open | Kornegay Gregory D | $165,938 | |
| Previous Owner | Suddreth Kathryn Caroline | $113,000 |
Source: Public Records
Tax History Compared to Growth
Tax History
| Year | Tax Paid | Tax Assessment Tax Assessment Total Assessment is a certain percentage of the fair market value that is determined by local assessors to be the total taxable value of land and additions on the property. | Land | Improvement |
|---|---|---|---|---|
| 2025 | $2,088 | $148,629 | $20,451 | $128,178 |
| 2024 | $1,263 | $78,229 | $16,000 | $62,229 |
| 2023 | $1,263 | $78,229 | $16,000 | $62,229 |
| 2022 | $1,263 | $78,229 | $16,000 | $62,229 |
| 2021 | $1,263 | $78,229 | $16,000 | $62,229 |
| 2020 | $1,232 | $78,229 | $16,000 | $62,229 |
| 2019 | $1,232 | $78,229 | $16,000 | $62,229 |
| 2018 | $1,197 | $78,229 | $16,000 | $62,229 |
| 2017 | $1,201 | $78,229 | $16,000 | $62,229 |
| 2014 | $1,475 | $98,685 | $16,000 | $82,685 |
| 2013 | -- | $98,685 | $16,000 | $82,685 |
| 2011 | -- | $98,685 | $16,000 | $82,685 |
Source: Public Records
Map
Nearby Homes
- 2105 Dallas Dr
- 2100 Emerson Rd
- 2803 Carey Rd
- 2106 Saint George Place
- 902 Rosanne Dr
- 2102 Hardee Rd
- 2301 Stallings Dr
- 2 Boy Scout Blvd
- 1912 Greenbriar Rd
- 1907 Essex St
- 7569 Carey Rd
- 2808 Brookhaven Dr
- 909 Cameron Dr
- 807 Cameron Dr
- Lot 13 Darby Ave
- 707 Cameron Dr
- 1206 W Highland Ave
- 1404 Carey Rd
- 3147 Fox Run Dr
- 844 Westminster Ln
- 1215 Airlee Dr
- 1213 Airlee Dr
- 1217 Airlee Dr
- 2007 Stanton Rd
- 1211 Airlee Dr
- 1210 Airlee Dr
- 1212 Airlee Dr
- 1219 Airlee Dr
- 1208 Airlee Dr
- 1214 Airlee Dr
- 2103 Stanton Rd
- 1209 Airlee Dr
- 1206 Airlee Dr
- 1216 Airlee Dr
- 1209 Dorcas Terrace
- 1211 Dorcas Terrace
- 1207 Dorcas Terrace
- 1600 Sabra Dr
- 2105 Stanton Rd
- 1601 Sabra Dr