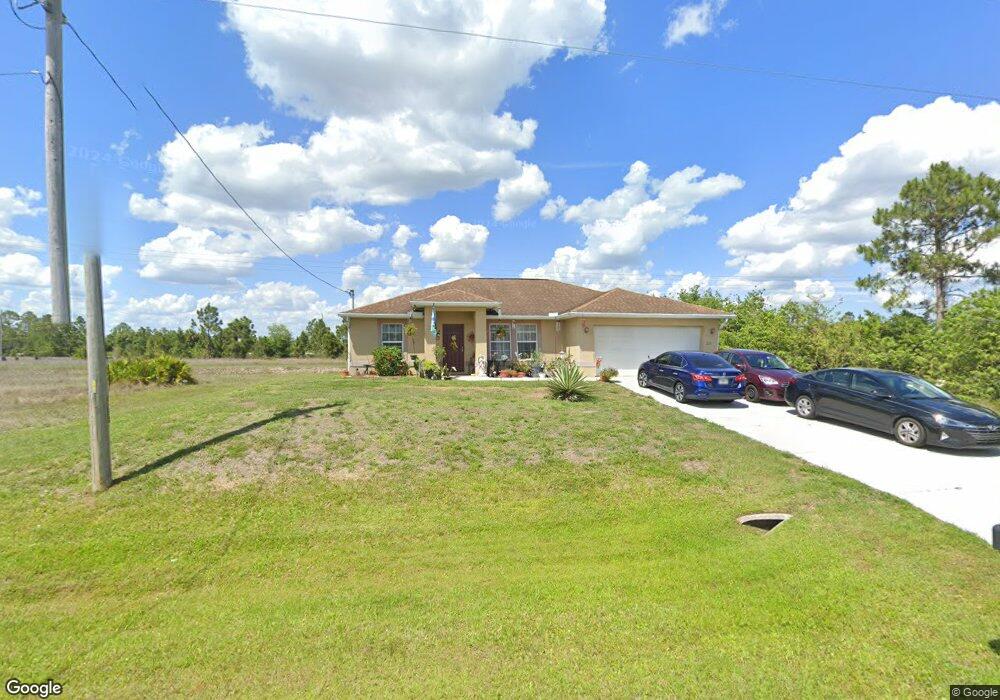
1215 Belgrave St Unit 10 Fort Myers, FL 33913
Estimated Value: $304,000 - $324,000
3
Beds
2
Baths
1,614
Sq Ft
$195/Sq Ft
Est. Value
About This Home
This home is located at 1215 Belgrave St Unit 10, Fort Myers, FL 33913 and is currently estimated at $314,734, approximately $195 per square foot. 1215 Belgrave St Unit 10 is a home located in Lee County with nearby schools including Lehigh Elementary School, Gateway Elementary School, and The Alva School.
Ownership History
Date
Name
Owned For
Owner Type
Purchase Details
Closed on
Apr 2, 2014
Sold by
Burright Diane
Bought by
Freedom Two Trust
Current Estimated Value
Purchase Details
Closed on
May 23, 2011
Sold by
Le Son
Bought by
Burright Diane
Purchase Details
Closed on
Jun 28, 2005
Sold by
Witt David
Bought by
Le Son
Home Financials for this Owner
Home Financials are based on the most recent Mortgage that was taken out on this home.
Original Mortgage
$209,950
Interest Rate
5.75%
Mortgage Type
Fannie Mae Freddie Mac
Purchase Details
Closed on
Oct 8, 2004
Sold by
Eagle Construction & Development
Bought by
Witt David
Purchase Details
Closed on
Aug 20, 2004
Sold by
Keizer Freddy and Keizer Maria
Bought by
Davis Richard
Purchase Details
Closed on
Jun 23, 2004
Sold by
Davis Richard
Bought by
Eagle Construction & Development Corp
Create a Home Valuation Report for This Property
The Home Valuation Report is an in-depth analysis detailing your home's value as well as a comparison with similar homes in the area
Home Values in the Area
Average Home Value in this Area
Purchase History
| Date | Buyer | Sale Price | Title Company |
|---|---|---|---|
| Freedom Two Trust | -- | None Available | |
| Burright Diane | $40,000 | Morgan & Associates Title Co | |
| Le Son | $43,000 | Progressive Title Inc | |
| Witt David | $12,000 | First American Title Ins Co | |
| Davis Richard | $7,200 | First American Title Ins Co | |
| Eagle Construction & Development Corp | -- | -- |
Source: Public Records
Mortgage History
| Date | Status | Borrower | Loan Amount |
|---|---|---|---|
| Previous Owner | Le Son | $209,950 |
Source: Public Records
Tax History Compared to Growth
Tax History
| Year | Tax Paid | Tax Assessment Tax Assessment Total Assessment is a certain percentage of the fair market value that is determined by local assessors to be the total taxable value of land and additions on the property. | Land | Improvement |
|---|---|---|---|---|
| 2025 | $3,201 | $193,074 | $15,343 | $177,731 |
| 2024 | $2,302 | $183,468 | -- | -- |
| 2023 | $2,982 | $166,789 | $0 | $0 |
| 2021 | $2,302 | $139,650 | $6,000 | $133,650 |
| 2020 | $2,205 | $130,822 | $5,000 | $125,822 |
| 2019 | $2,161 | $125,173 | $5,500 | $119,673 |
| 2018 | $2,010 | $111,433 | $3,700 | $107,733 |
| 2017 | $1,942 | $109,821 | $3,630 | $106,191 |
| 2016 | $1,765 | $92,091 | $3,630 | $88,461 |
| 2015 | $1,608 | $77,808 | $3,530 | $74,278 |
| 2014 | -- | $70,494 | $2,350 | $68,144 |
| 2013 | -- | $59,208 | $2,200 | $57,008 |
Source: Public Records
Map
Nearby Homes
- 1210 Belgrave St
- 1227 Belgrave St
- 1229 Belgrave St
- 1214 Belgrave St
- 1256 Belgrave St
- 1217 Belgrave St
- 1209 Briarcliffe St
- 1247 Brunell Ave
- 1249 Bowles Ave
- 1241 Songbird St
- 1252 Brunell Ave
- 1262 Bowles Ave
- 1256 Brunell Ave
- 1252 Belfast Ave Unit 16
- 1137 Briarcliffe St
- 1237 Briarcliffe St
- 1235 Briarcliffe St
- 1223 Briarcliffe St
- 1175 Briarcliffe St
- 1239 Briarcliffe St
- 1231 Belgrave St Unit 16
- 1210 Belgrave St Unit 5
- 1135 Belgrave St Unit 18
- 1236 Belgrave St
- 1208 Belgrave St
- 1209 Belgrave St
- 1207 Belgrave St
- 1135 Belgrave St
- 1225 Belgrave St
- 1246 Belgrave St
- 1129 Belgrave St
- 1221 Belgrave St
- 1212 Belgrave St
- 1240 Belgrave St
- 1117 Belgrave St
- 1133 Belgrave St
- 1238 Belgrave St
- 1257 Belgrave St
- 1216 Belgrave St
- 1216 Belgrave St